The table shows the number of people who responded to a survey about their favorite style of music.What percentage of respondents aged 21−30 indicated a favourite style other than Rock music?
64%
60%
75%
36%
The correct Answer is:A
Step by step video, text & image solution for The table shows the number of people who responded to a survey about their favorite style of music.What percentage of respondents aged 21 - 30 indicated a favourite style other than Rock music? by Maths experts to help you in doubts & scoring excellent marks in Class 14 exams.
Updated on:21/07/2023Topper's Solved these Questions
- DATA TABLE BOOK - ARIHANT SSCCHAPTER - DATA TABLE EXERCISE - HIGHER SKILL LEVEL QUESTIONS
25 Videos
- DATA TABLE BOOK - ARIHANT SSCCHAPTER - DATA TABLE EXERCISE - HIGHER SKILL LEVEL QUESTIONS
25 Videos
- DATA SUFFICIENCYBOOK - ARIHANT SSCCHAPTER - DATA SUFFICIENCYEXERCISE - FAST TRACK PRACTICE
30 Videos
- DISCOUNTBOOK - ARIHANT SSCCHAPTER - DISCOUNTEXERCISE - FAST TRACK PRACTICE
47 Videos
Similar Questions
Direction: The pie chart shows the results of an online survey which asked students about their favorite subject. Study the graph carefully and answer the following questions.
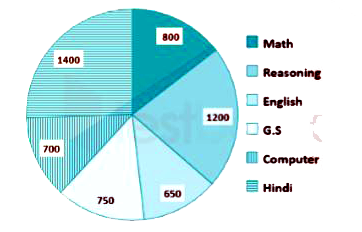
What is the ratio of students who say their favourite subject is G.S and English taken together to the students who say their favorite subject is Computer and Reasoning taken together?
View SolutionThe table given below shows number of literate people and total population in a village from the year 2011 to 2016.

What is the percentage of people who are literate in 2012?
View Solution
Knowledge Check
The table shows the number of people who responded to a survey about their favorite style of music. What percentage of respondents under 31 indicated that Blues is their favourite style of music?
A7.1%B7.6%C8.3%D14.1The table shows the number of people who responded to a survey about their favorite style of music.What percentage of the total sample indicated that Jazz is their favourite style of music?
A6%B8%C22%D12%The table given below shows number of literate people and total population in a village from the year 2011 to 2016.

What is the percentage of people who are literate in 2012?A26.49B27.92C29.14D22.74
The pie charts shows the results of an online survey which asked people about their favourite game. Study the diagram and answer the following questions. Find percentage people who say their favorite game is Cricket and Hockey of the total people?
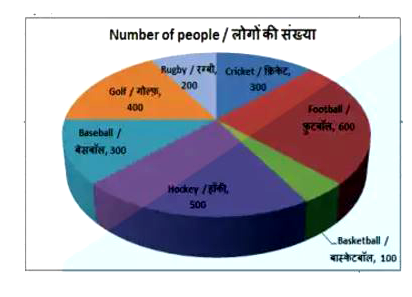
View SolutionThe pie chart shows the results of an online survey which asked people about their favourite author. Study the diagram and answert he following questions.
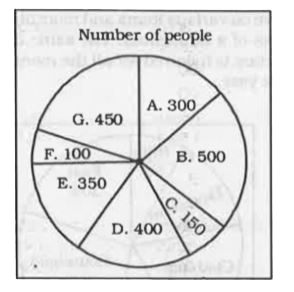
Respondents who say their favourite author is A and those who say their favourite author is B constitute what per cent of the total respendents?
View SolutionThe pie chart shows the results of an online survey which asked people about their favourite game. Study the diagram and answer the following questions.
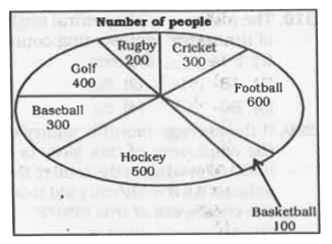
Respondents who say their favourite game is Cricket and those who say their favourite game is Hockey constitute what per cent of the total respendents?
View SolutionThe pie chart shows the results of an online survey which asked people about their favourite movie. Study the diagram and answert he following questions.
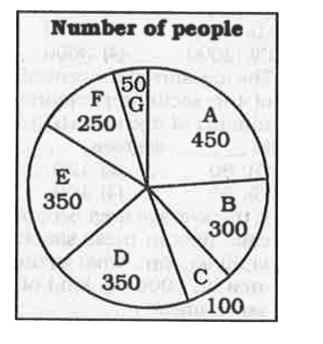
Respondents who say their favourite movie is D and those who say their favourite movie is B constitute what per cent of the total respendents?
View SolutionThe pie chart shows the results of an online survey which asked people about their favourite author. Study the diagram and answert he following questions.

Respondents who say their favourite author is A and those who say their favourite author is B constitute what per cent of the total respendents?
View Solution
