Study the following table carefully and answer the questions given below:
Number (N) of Candidates (In lakhs) Appearing for An Entrance Examination from six different States and The percentage (P) of candidates clearing the Same over the years.
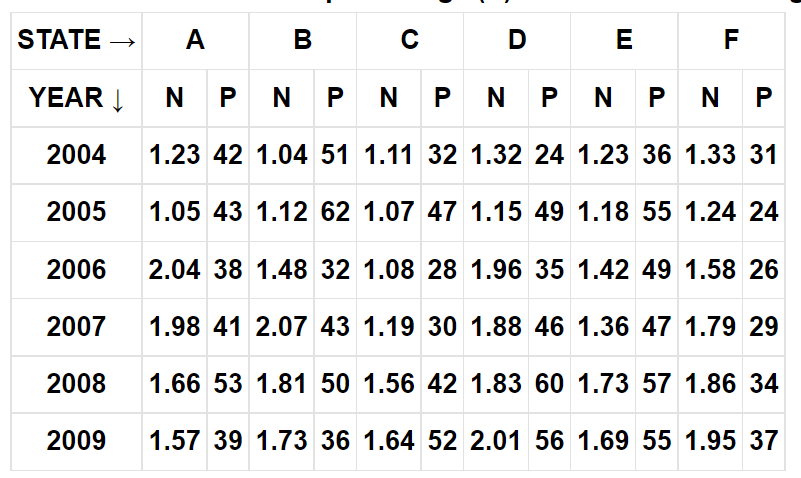
2008
2006
2009
2007
The correct Answer is:C
Topper's Solved these Questions
Similar Questions
Directions (Questions 16 to 20): Study the following table carefully and answer the questions that follow: Number of Candidates (in lakhs) Appearing In an Entrance Examination From Six Different Cities City A B C D E F Number of candidates 1.25 3.14 1.08 2.27 1.85 2.73 Ratio of Candidates Passing And Failing Within the City City Ratio of Passing and Failing A 7 : 3 B 5 : 3 C 4 : 5 D 1 : 3 E 3 : 2 F 7 : 5 What is the ratio of the number of candidates failing the exam from City D to that of those failing the exam from City A ? (a) 289 : 42 (b) 42 : 289 (c) 227 : 50 (d) 50 : 227 (e) None of these
View SolutionStudy the following table carefully to answer these questions ---
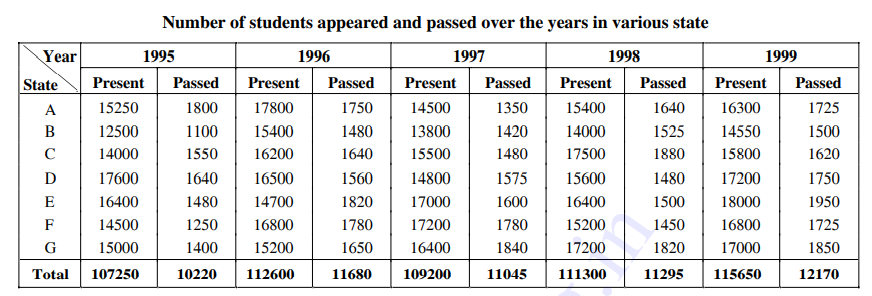
What is the average number of students appeared in B for all years ?
View Solution
Knowledge Check
Study the following table carefully and answer the questions given below-

Who amongst them secured highest percentage of marks?AChiragBEhsanCAmitDBhavnaStudy the following table carefully and answer the questions given below it. Number of candidates appearing for an interview for a post in Bank and percentage of candidates qualifying
Figure
What was the respective ratio of the number of candidates who qualified in bank A to the number of candidates who qualified in bank E?A5:6B2:5C3:7D5:8Study the following table carefully and answer the questions given below it. Numberof candidates appearing for an interview fora post in Bank and percentage of candidates qualifying
Figure
What was the average number of candidates who appeared for the interview in bank A, C and E together?
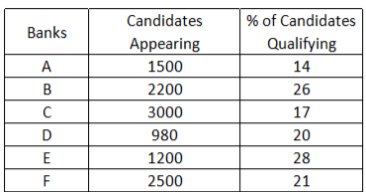 A2000B1800C1900D1500
Study the following graph carefully and answer the question given below
Number of candidates appeared (in thousand) and percentage of candidates qualified in a competitive examination over the years.
No. of candidates appeared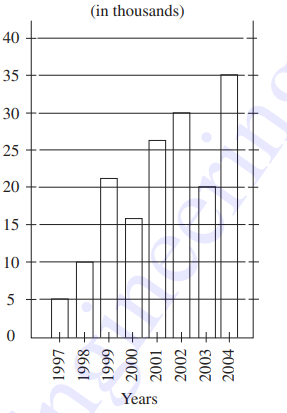
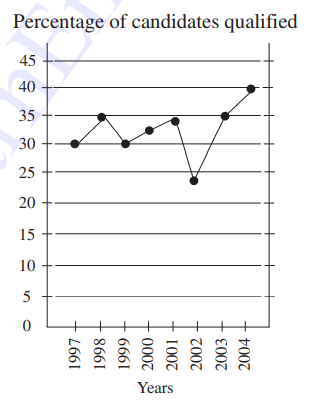
How many candidates qualified in the year 2002?
View SolutionStudy the following graph carefully and answer the question given below
Number of candidates appeared (in thousand) and percentage of candidates qualified in a competitive examination over the years.
No. of candidates appeared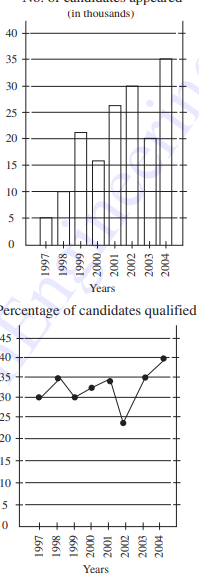
What was the percentage drop in thee number of candidates appeared from the year 2002 to 2003?
View SolutionStudy the following graph carefully and answer the question given below
Number of candidates appeared (in thousand) and percentage of candidates qualified in a competitive examination over the years.
No. of candidates appeared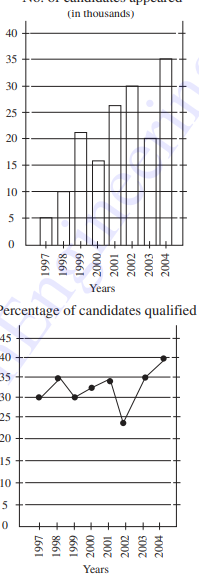
The number of candidates qualified in 1999 was what percentage of the number of candidates appeared in 1998?
View SolutionStudy the following graph carefully and answer the question given below
Number of candidates appeared (in thousand) and percentage of candidates qualified in a competitive examination over the years.
No. of candidates appeared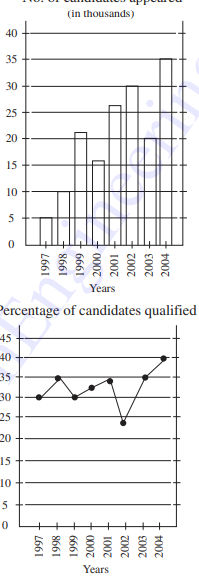
In which of the following years was the number of candidates qualified the lowest among the given years?
View SolutionStudy the following graph carefully and answer the question given below
Number of candidates appeared (in thousand) and percentage of candidates qualified in a competitive examination over the years.
No. of candidates appeared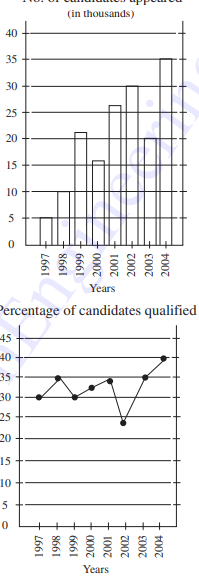
What was the ratio between the number of candidates appeared in 1997 and the number of candidates qualified in 2004?
View Solution
