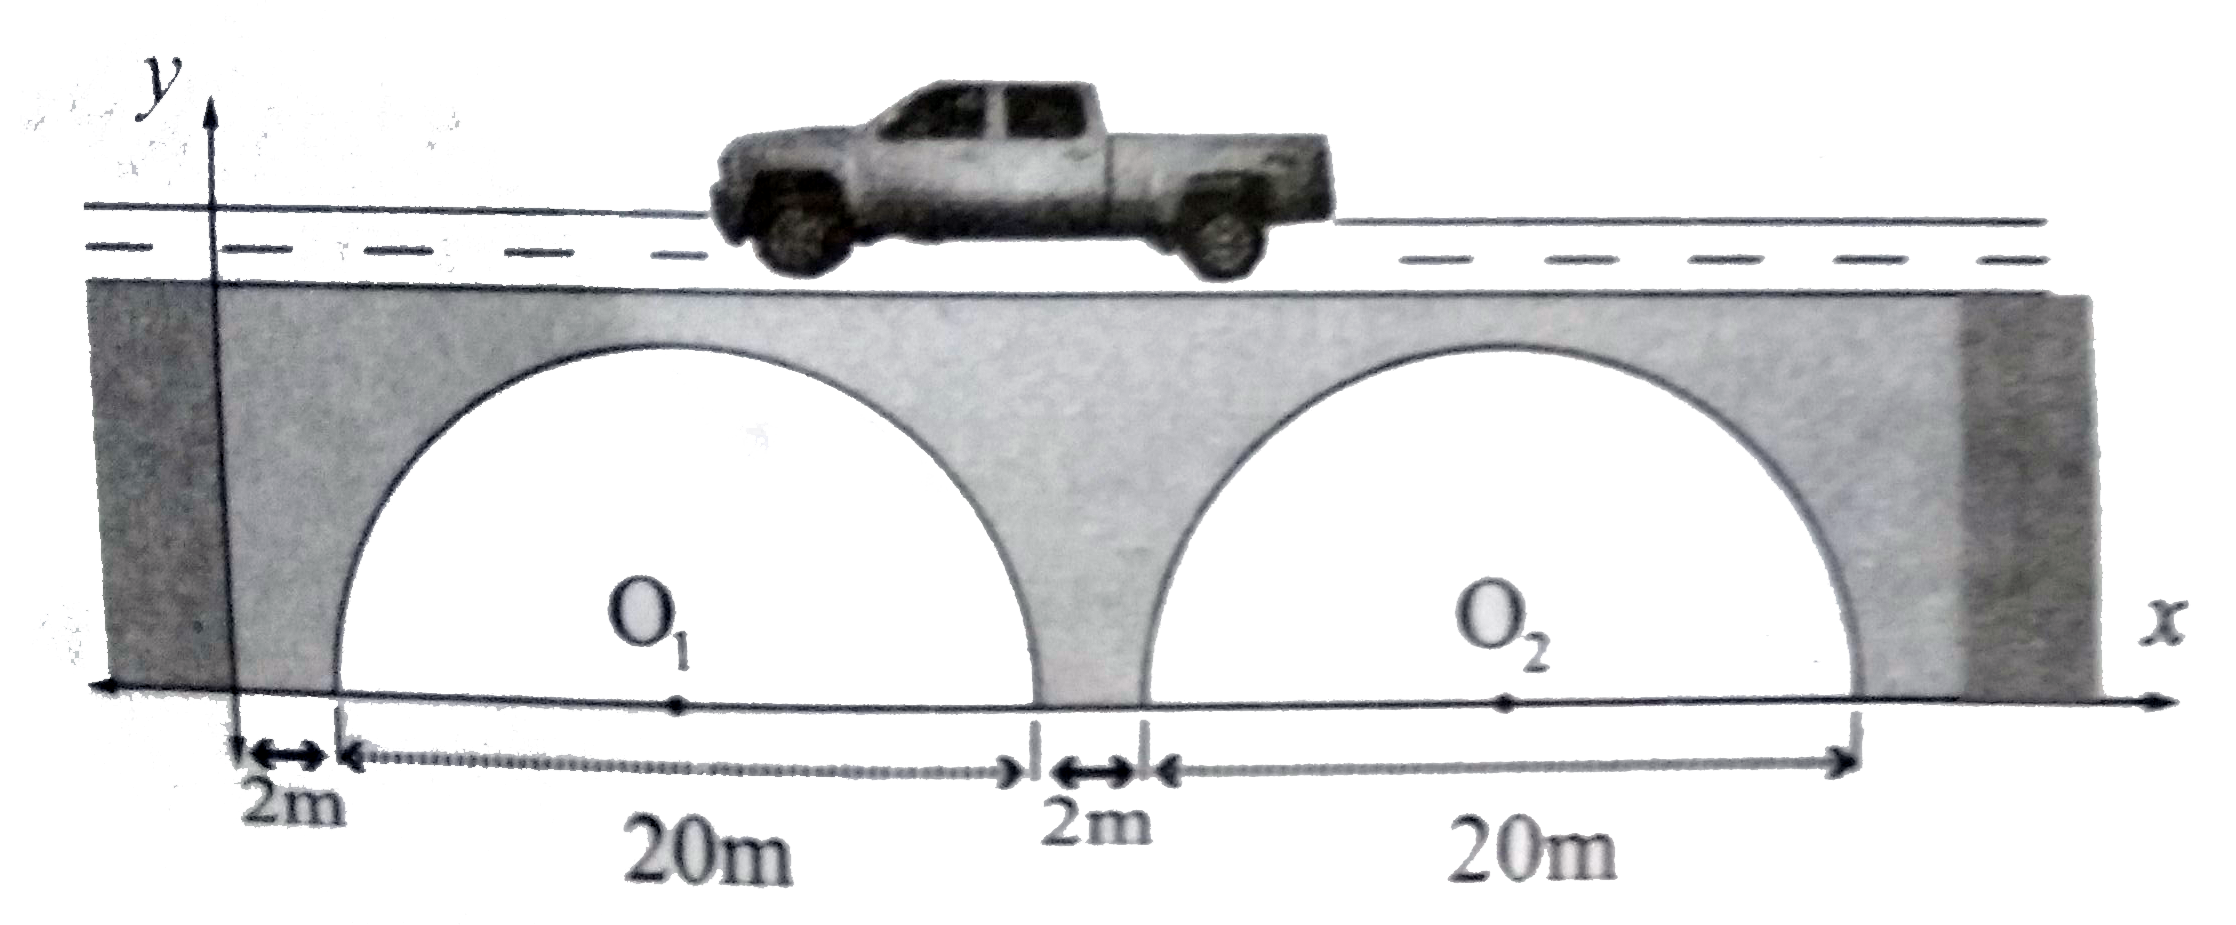
A road bridge over an irrigation canal have two semi circular vents each with a span of 20 m and the supporting pillars of width 2m. Use figure to write the equations that represent the semi verticular vents.
 Solution in Tamil
Step by step video & image solution for A road bridge over an irrigation canal have two semi circular vents each with a span of 20 m and the supporting pillars of width 2m. Use figure to write the equations that represent the semi verticular vents. by Maths experts to help you in doubts & scoring excellent marks in Class 12 exams.
Updated on:21/07/2023Topper's Solved these Questions
- SAMPLE PAPER -12 (UNSOLVED)BOOK - FULL MARKSCHAPTER - SAMPLE PAPER -12 (UNSOLVED)EXERCISE - PART-II
10 Videos
- SAMPLE PAPER -12 BOOK - FULL MARKSCHAPTER - SAMPLE PAPER -12 EXERCISE - PART-I
1 Videos
- SAMPLE PAPER -13 BOOK - FULL MARKSCHAPTER - SAMPLE PAPER -13 EXERCISE - PART-I (CHOOSE THE CORRECT ANSWER. ANSWER ALL THE QUESTION)
1 Videos
Similar Questions
Find the rank of each of the following matrices: ⎡⎢⎣325112336⎤⎥⎦
View SolutionIf A=[3512],B=adjAandC=3A, then |adjB||C|=.......
View SolutionIf A=[cosθsinθ−sinθcosθ] and A(adj A) = [k00k], then k=……………
View SolutionHow many lines of symmetry does the above figure have ?
View SolutionDetermine the point of symmetry of a regular hexagon.
View SolutionDtermine the images of the following figure about the given line :
View SolutionMatch the following Column A to Column B

View SolutionMatch the following Column A to Column B

View SolutionMatch the following Column A to Column B

View SolutionFind the area of the figure given below.

View SolutionThe area of the shaded part in the figure given below is ______.

View SolutionThe inequation represented by the graph given below is :
View SolutionThe inequation that best describes the graph given below is _________
View SolutionThe inequation that best describes the following graph is _________
View SolutionWhich inequations represent the shaded region in the given figure
View SolutionThe equation of straight line shown in figure is :
ltimg src="https://d10lpgp6xz60nq.cloudfront.net/physics_images/ALN_PHY_R04_E01_020_Q01.png" width="80%"gt
View Solution
