Why the share of agricultural sector in total water used in the country is expected to decline?
At present the agriculture use accounts for the highest share of utilization for both ground and surface water resources. The main reason being that the agriculture accounts or the largest share in economy of the country, but in recent times the share of secondary and tertiary activities have been rising in the economy. As We This in turn will reduce the share of the agriculture and increase the share of industrial and domestic sector in the consumption of all resources including the water resources of the country.
Topper's Solved these Questions
- BOOK - FULL MARKSCHAPTER - WATER RESOURCESEXERCISE - ADDITIONAL QUESTIONS SOLVED (VERY SHORT ANSWER TYPE QUESTIONS)23videos
WATER RESOURCES
- BOOK - FULL MARKSCHAPTER - WATER RESOURCESEXERCISE - ADDITIONAL QUESTIONS SOLVED (SHORT ANSWER TYPE QUESTIONS)11videos
WATER RESOURCES
- BOOK - FULL MARKSCHAPTER - USE OF COMPUTER IN DATA PROCESSING AND MAPPINGEXERCISE - TEST ASSIGNMENT5videos
USE OF COMPUTER IN DATA PROCESSING AND MAPPING
Similar Questions
Knowledge Check
- Question 1 - Select One
The highest proportion of the total water used in the country is in which one of the following sectors?
AIrrigationBIndustriesCDomestic useDNone of the above - Question 2 - Select One or More
Rearrange the parts of the sentence in correct order.
P: In the least-developed countries, if agricultural productivity were drastically reduced by climate change, the cost of living would rise by one or two percent, and at a time when per capita income will likely have doubled.
Q: It may still be vulnerable to climate change for many years to come.
R: In developing countries, in contrast, as much as a third of GNP and half the population currently depends on agriculture.
S: Agriculture is practically the only sector of the economy affected by climate.APQRSBRQPSCRPSQDQRSP - Question 3 - Select One
Consider the following statements in regard to Gross Domestic product (GDP) of India:
(1) Between 1951 and 2000 the share of agriculture in GDP fell from around 56% to around 25%
(2) Share of the services sector in GDP was less than industrial sector between 1951 and 2000
Which of the statements given below is/are not correct?A1 onlyB2 onlyCBoth 1 and 2DNeither 1 nor 2
Why do you think that the share of formal sector credit is higher for the richer households compared to the poorer households?
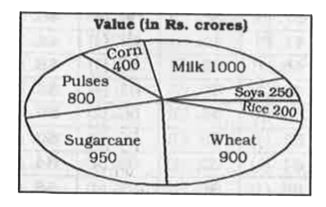
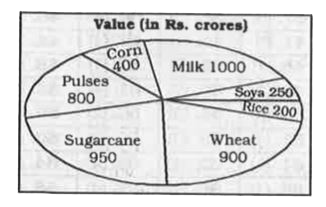
View SolutionThe pie chart shows the value of the total annual agricultural production of a country. Study the diagram and answer the following questions.

What is the total value (in Rs. crores) of the annual agricultural production of the country?View SolutionThe pie chart shows the value of the total annual agricultural production of a country. Study the diagram and answer the following questions.

The measured of the central angle of the sector representing the production of milk is ____ degrees.View SolutionThe pie chart shows the value of the total annual agricultural production of a country. Study the diagram and answer the following questions.

The measured of the central angle of the sector representing the production of milk is ____ degrees.View Solution. ____ % water is used for agriculture in India
View Solution
