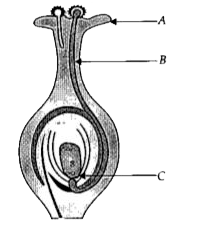
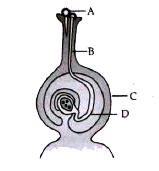
Study the diagrams given below and compare. Give reasons for their variation

From the above diagrams, it is clear that , in both the case it is the agricultural sector that users maximum share of both surface and groundwater . We need more crops in orders to feed our large population for which water is essential , its easy for households to utilize more of surface water from rivers, ponds etc. industries can afford to utilize more of underground water.
Topper's Solved these Questions
- WATER RESOURCESBOOK - FULL MARKSCHAPTER - WATER RESOURCESEXERCISE - ADDITIONAL QUESTIONS SOLVED (HIGH ORDER THINKING SKILLS)
2 Videos
- WATER RESOURCESBOOK - FULL MARKSCHAPTER - WATER RESOURCESEXERCISE - PREVIOUS YEAR BOARD QUESTIONS SOLVED (VERY SHORT ANSWER TYPE QUESTIONS)
6 Videos
- WATER RESOURCESBOOK - FULL MARKSCHAPTER - WATER RESOURCESEXERCISE - ADDITIONAL QUESTIONS SOLVED (LONG ANSWER TYPE QUESTIONS)
5 Videos
- USE OF COMPUTER IN DATA PROCESSING AND MAPPINGBOOK - FULL MARKSCHAPTER - USE OF COMPUTER IN DATA PROCESSING AND MAPPINGEXERCISE - TEST ASSIGNMENT
5 Videos
Similar Questions
Knowledge Check
Study the diagrams given below. These indicate:
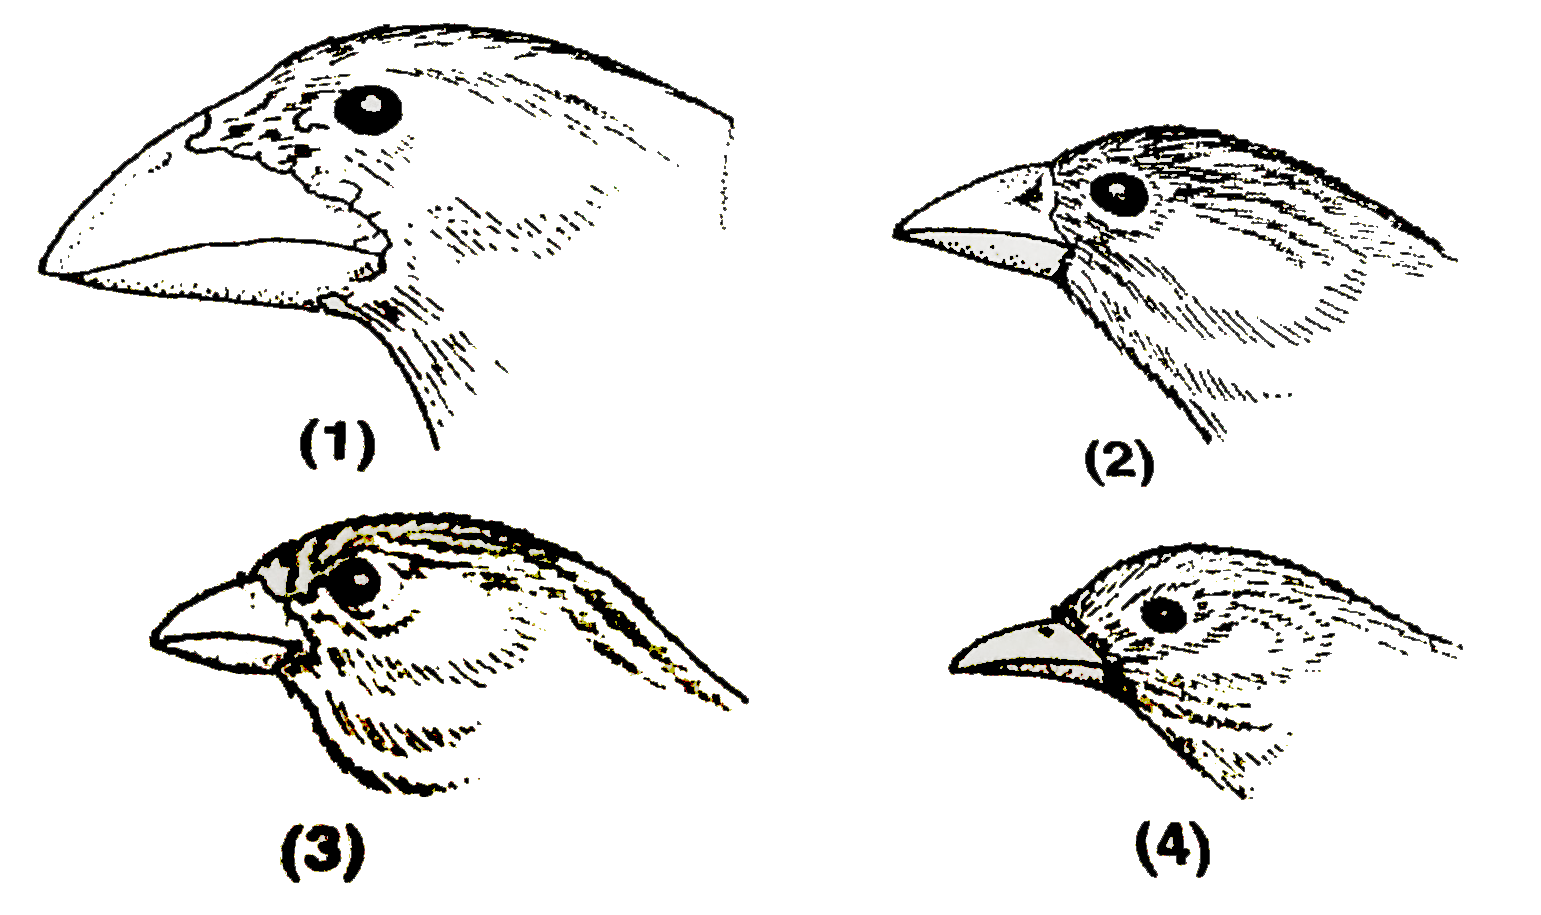 AanalogyBhomologyCadaptive radiationDconvergent evolution
Study the diagram given below and answer the questions that follow:
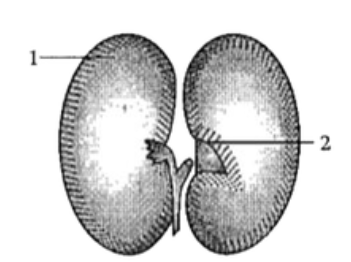
Which part of it give rise to the root of the plant?
View SolutionStudy the diagram given below and answer the questions that follow:
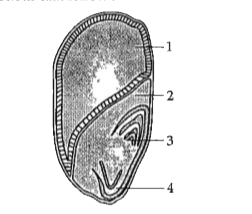
Is the given structure albuminous or non albuminous ? Give reason for your answer.
View SolutionStudy the diagram given below
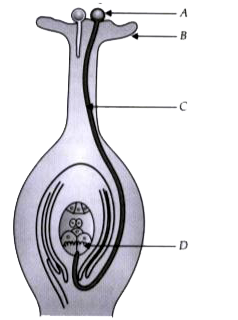
The part labelled as A in the diagram is:
View SolutionStudy the diagram given below and answer the questions that follow :

Is the given structure-an animal cell or a plant cell? Give reason in support of your answer.
View SolutionStudy the diagram given below and answer the questions that follow :
Name the pigment that gives colour to the skin.
View SolutionStudy the diagram given below and answer the questions that follow :
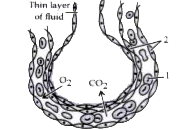
Name the structure given in the diagram. State in which part of the body it is present.
View SolutionStudy the diagram given below and answer
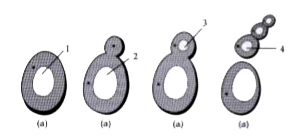
Identify the above process.
View Solution

