Explain the procedure of tabulating and making frequency distribution with the help of an example.
Marks obtained by students in Geography are given below.

Make a frequency distribution.
Find the difference between the largest and the smallest items. Highest value is 97 and lowest value is 7. Therefore, the difference is 90 (97-7).
Step-2: Keeping in mind the range the class interval will be 10 and classes will be 0-10, 10-20, 20-30, etc.
Step-3: It is to be noted that upper limit is excluded and lower limit is included in the class. i.e. the value 30 will be included in 30-40 not in 20-30.


Conclusions derived from analysis:
(a) The highest number of students lie in the class interval 50-60, i.e. 10.
(b) Only 3 students have got marks between 0-10.
(c) Only 14 students have got marks less than 40%.
(d) 2 students have got marks more than 90.
(e) 48 students have got marks less than 90.
Topper's Solved these Questions
- DATA-ITS SOURCE AND COMPLIATIONBOOK - FULL MARKSCHAPTER - DATA-ITS SOURCE AND COMPLIATIONEXERCISE - ADDITIONAL QUESTION SOLVED (IV. VIVA-VOCE QUESTIONS)
8 Videos
- DATA-ITS SOURCE AND COMPLIATIONBOOK - FULL MARKSCHAPTER - DATA-ITS SOURCE AND COMPLIATIONEXERCISE - ADDITIONAL QUESTION SOLVED (II. SHORT ANSWER QUESTIONS)
3 Videos
- GRAPHICAL REPRESENTATION OF DATABOOK - FULL MARKSCHAPTER - GRAPHICAL REPRESENTATION OF DATAEXERCISE - TEST ASSIGNMENT
3 Videos
Similar Questions
Knowledge Check
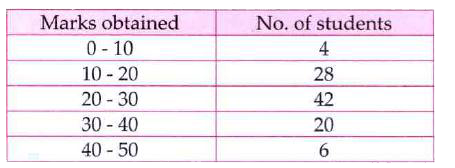
In the given table, frequency distribution of marks obtained by the stubents in a question paper of mathematics are given below

Then, median of marks isA27.7B25C17.3D9
Find the mean and variance of the frequency distribution given below

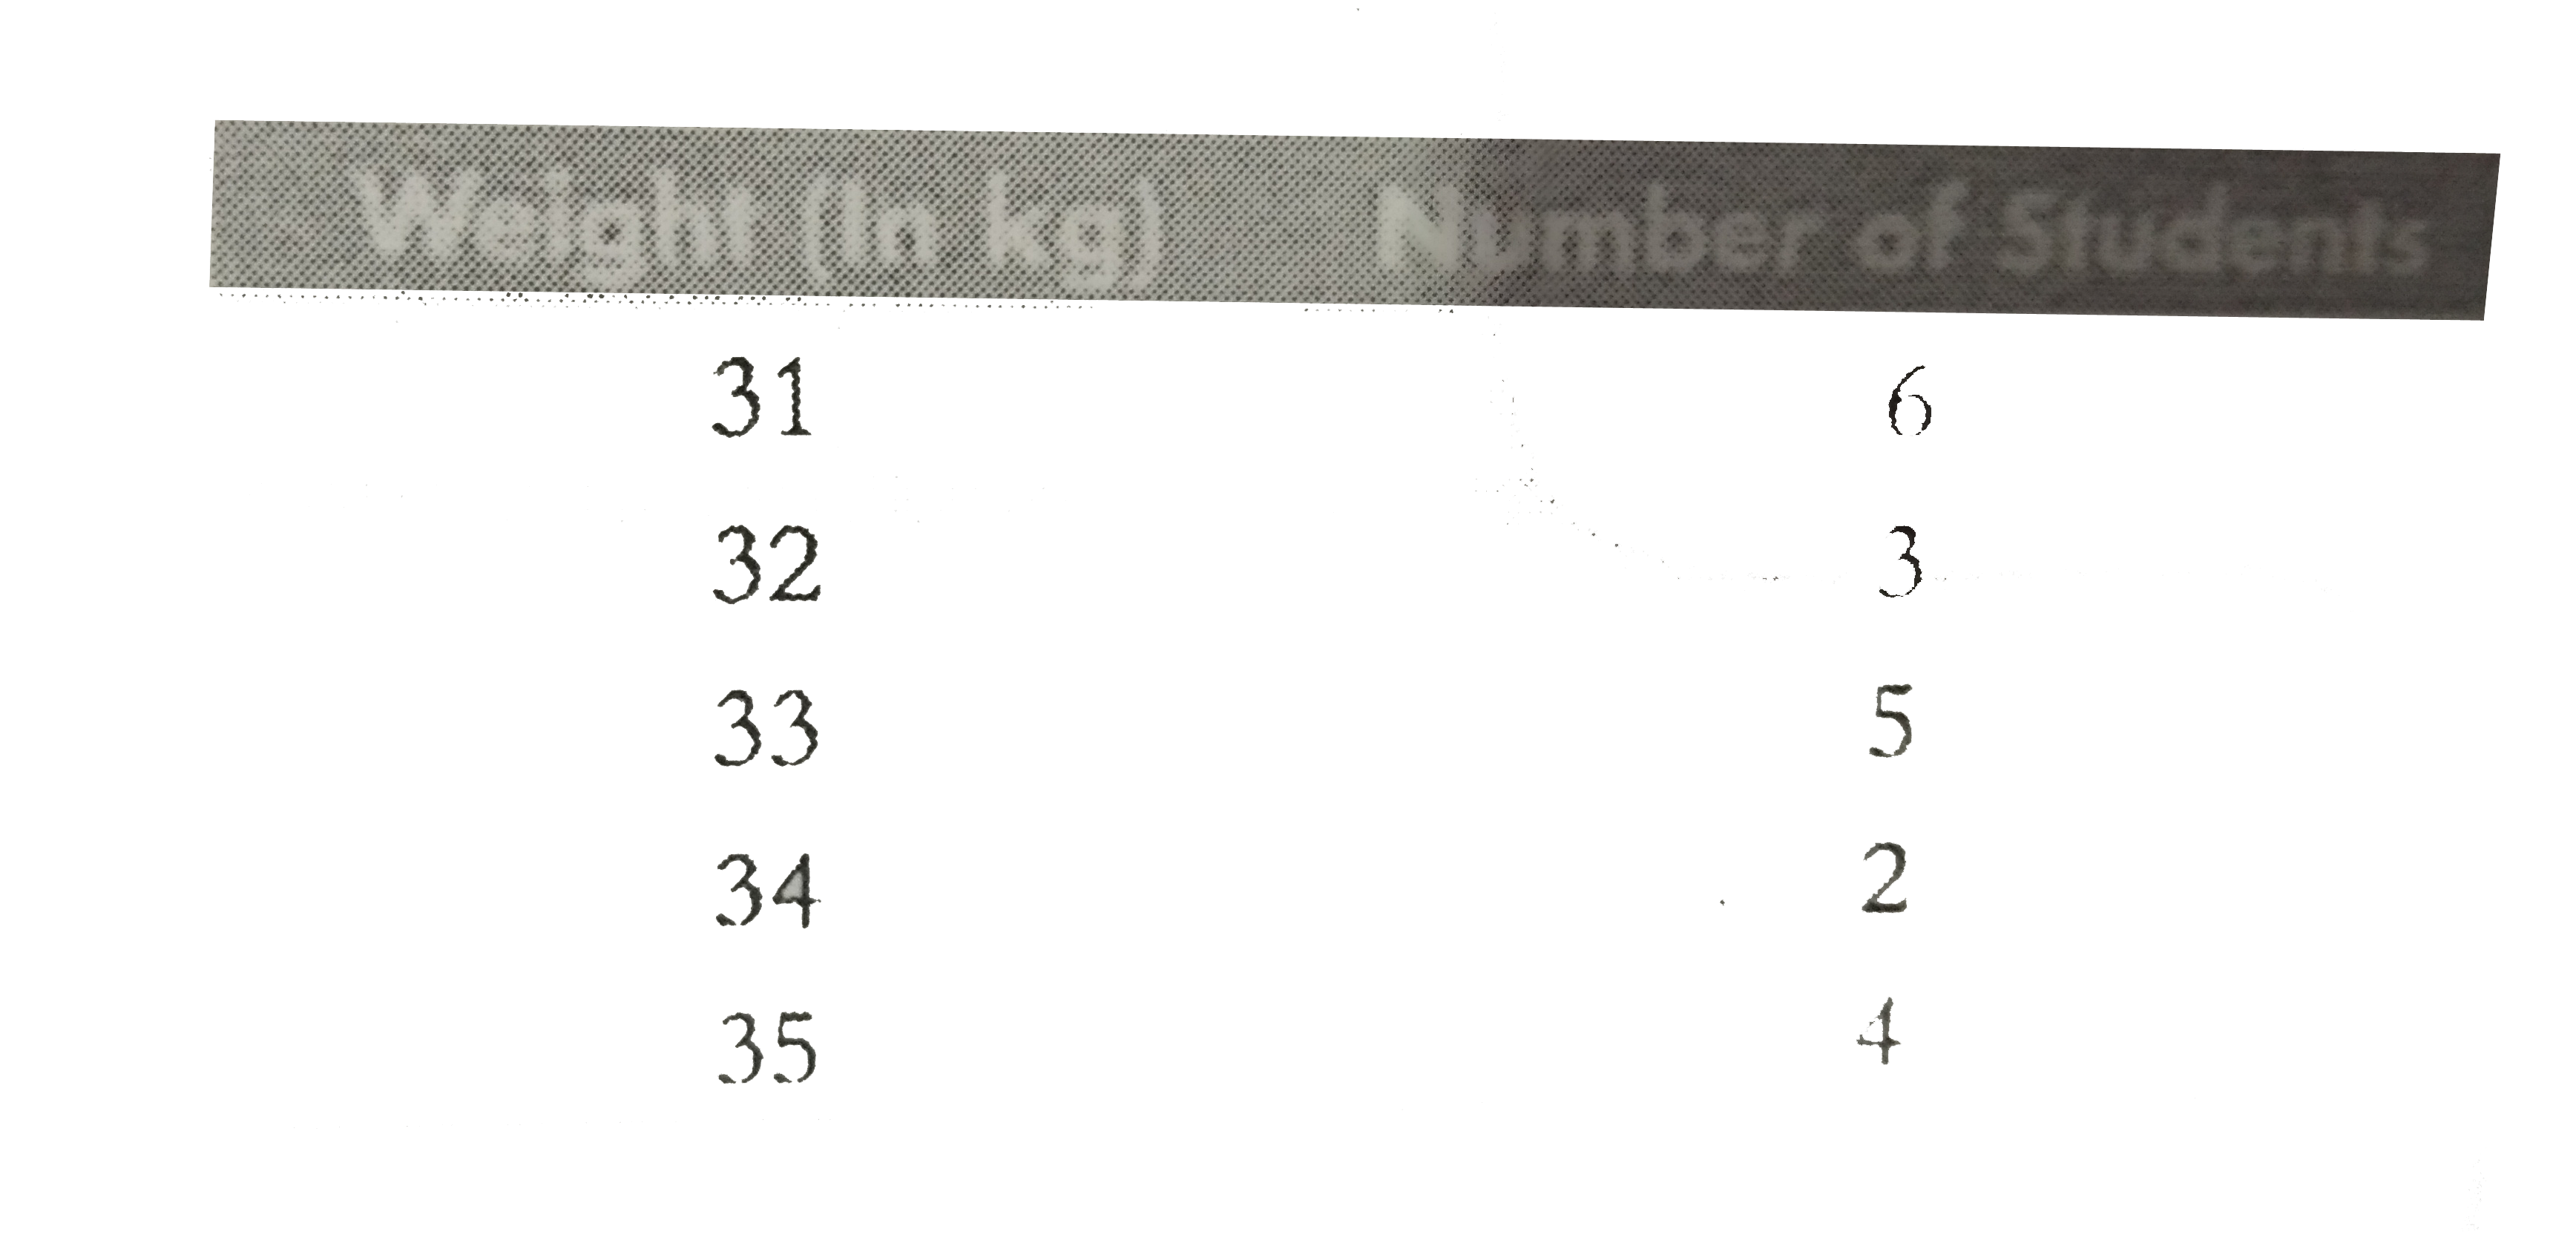
View SolutionThe weights of 20 students in a class are given below.

Find the median of the above frequency distribution .
View SolutionThe median of a frequency distribution is found graphically with the help of
View SolutionThe marks of students of a class are given in following frequency distribution. Find the mean.

View SolutionThe distribution given below, shows the marks obtained by 25 students in an aptitude test. Find the median and mode of the distribution.
View SolutionIf for somex∈R, the frequency distribution of the marks obtained by 20 students in a test is:

Then the mean of the marks is:
View SolutionIf for somex∈R, the frequency distribution of the marks obtained by 20 students in a test is:

Then the mean of the marks is:
View Solution


