Read the cartoon given below and answer the questions that follow:

(i) What does the cartoon represent? (ii) The Chief Minister is not happy after winning the confidence motion! Can you imagine why this is so?
(i) The cartoon represents the need of a confidence vote by the members of Legislative Assembly for the Chief Minister at the state level.
(ii) Because after the Chief Minister gets the confidence vote of the members, he is bound by the limitations set by members in place of independent decision taken by himself or he has to make some compromises also to compensate the confidence vote of members.
Topper's Solved these Questions
- EXECUTIVE BOOK - FULL MARKSCHAPTER - EXECUTIVE EXERCISE - ADDITIONAL QUESTIONS WITH ANSWERS (V. Long Answer Type Questions)
2 Videos
- EQUALITYBOOK - FULL MARKSCHAPTER - EQUALITYEXERCISE - ADDITIONAL QUESTIONS WITH ANSWERS ( V. Long Answer Type Questions- II)
2 Videos
- FEDERALISMBOOK - FULL MARKSCHAPTER - FEDERALISMEXERCISE - RESOURCE MATERIAL (LONG ANSWER TYPE QUESTIONS)
1 Videos
Similar Questions
Read the cartoon given below and answer the questions that follow:
(i) What does the cartoon represent?
(ii) Should a person accused of a serious crime be barred from contesting an elections?
View SolutionRead the frequency distribution table given below and answer the questions that follow:
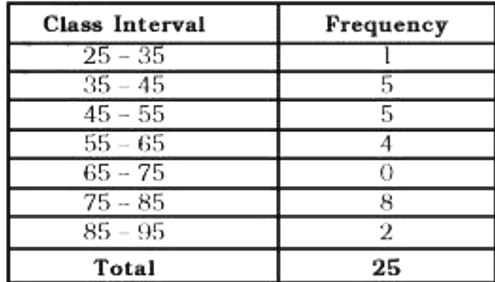
What is the class size of the intervals?
View Solution
Knowledge Check
Read the information given below and answer the questions that follow :
What is the value of fo(fog)o(gof)(x)?AxBx2C2x+3Dx+34x−5Read the information given below and answer the questions that follow :
For what value of x,f(x)=g(x−3)?A−3B1/4C−4DNone of theseRead the information given below and answer the questions that follow :
What is value of (gofofogogof)(x)(fogofog)(x)?AxBx2C5x+34x−1D(x+3)(5x+3)(4x−5)(4x−1)
Read the frequency distribution table given below and answer the questions that follow:
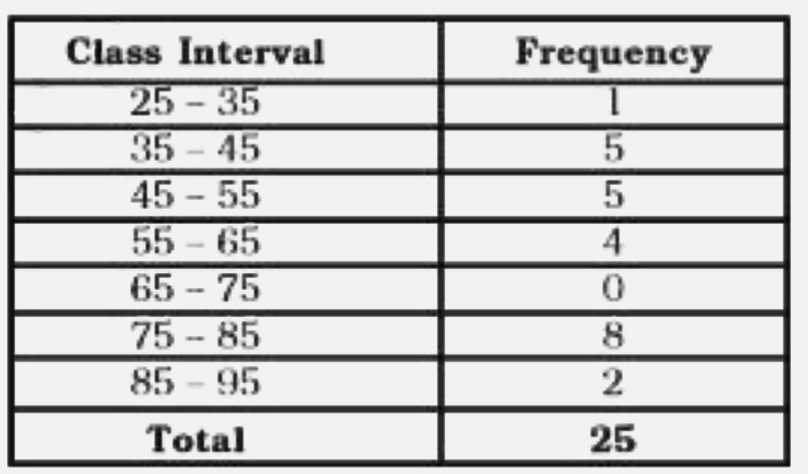
What is the upper limit of the fifth class?
View SolutionRead the frequency distribution table given below and answer the questions that follow:
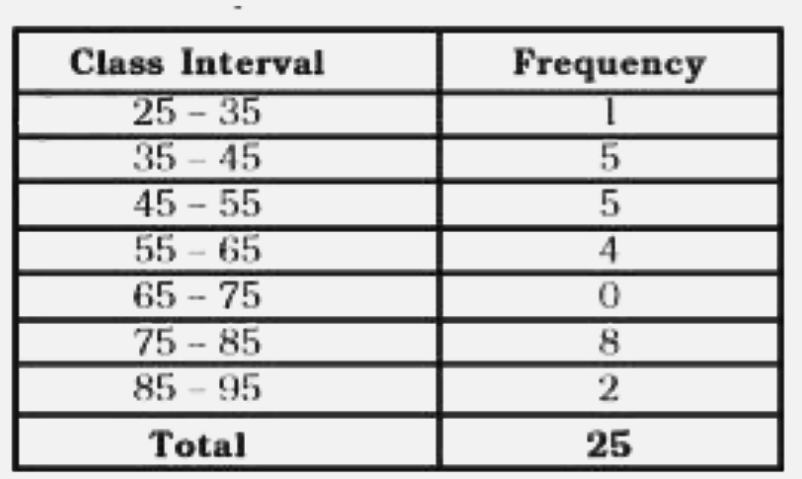
What is the lower limit of the last class?
View SolutionRead the given bar graph and answer the question that follow :
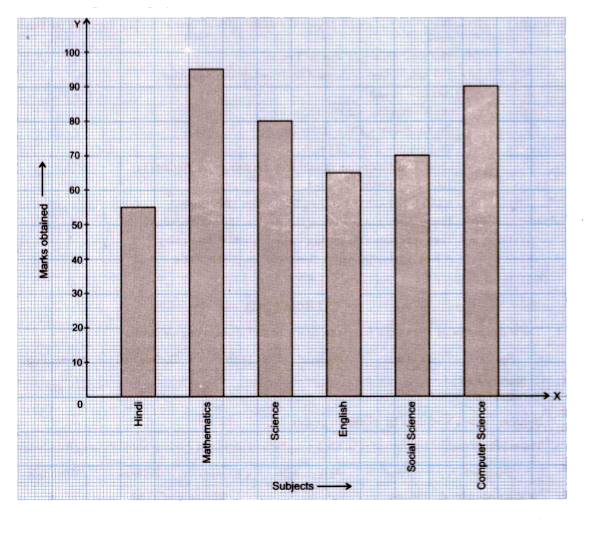
What information is represented by the bar graph?
View SolutionObserve the figure given below, and answer the question.
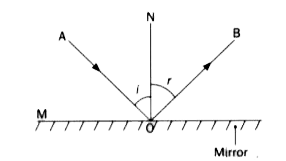
What does NO represent?
View SolutionStudy the picture given below and answer the questions that follows:
(i) What does this picture represent?
(ii) Mention some consequences of partition.
(iii) Which year is being denoted in the picture?
View Solution
