The following results show the number of workers and the wages paid to them in two factories F1andF2.
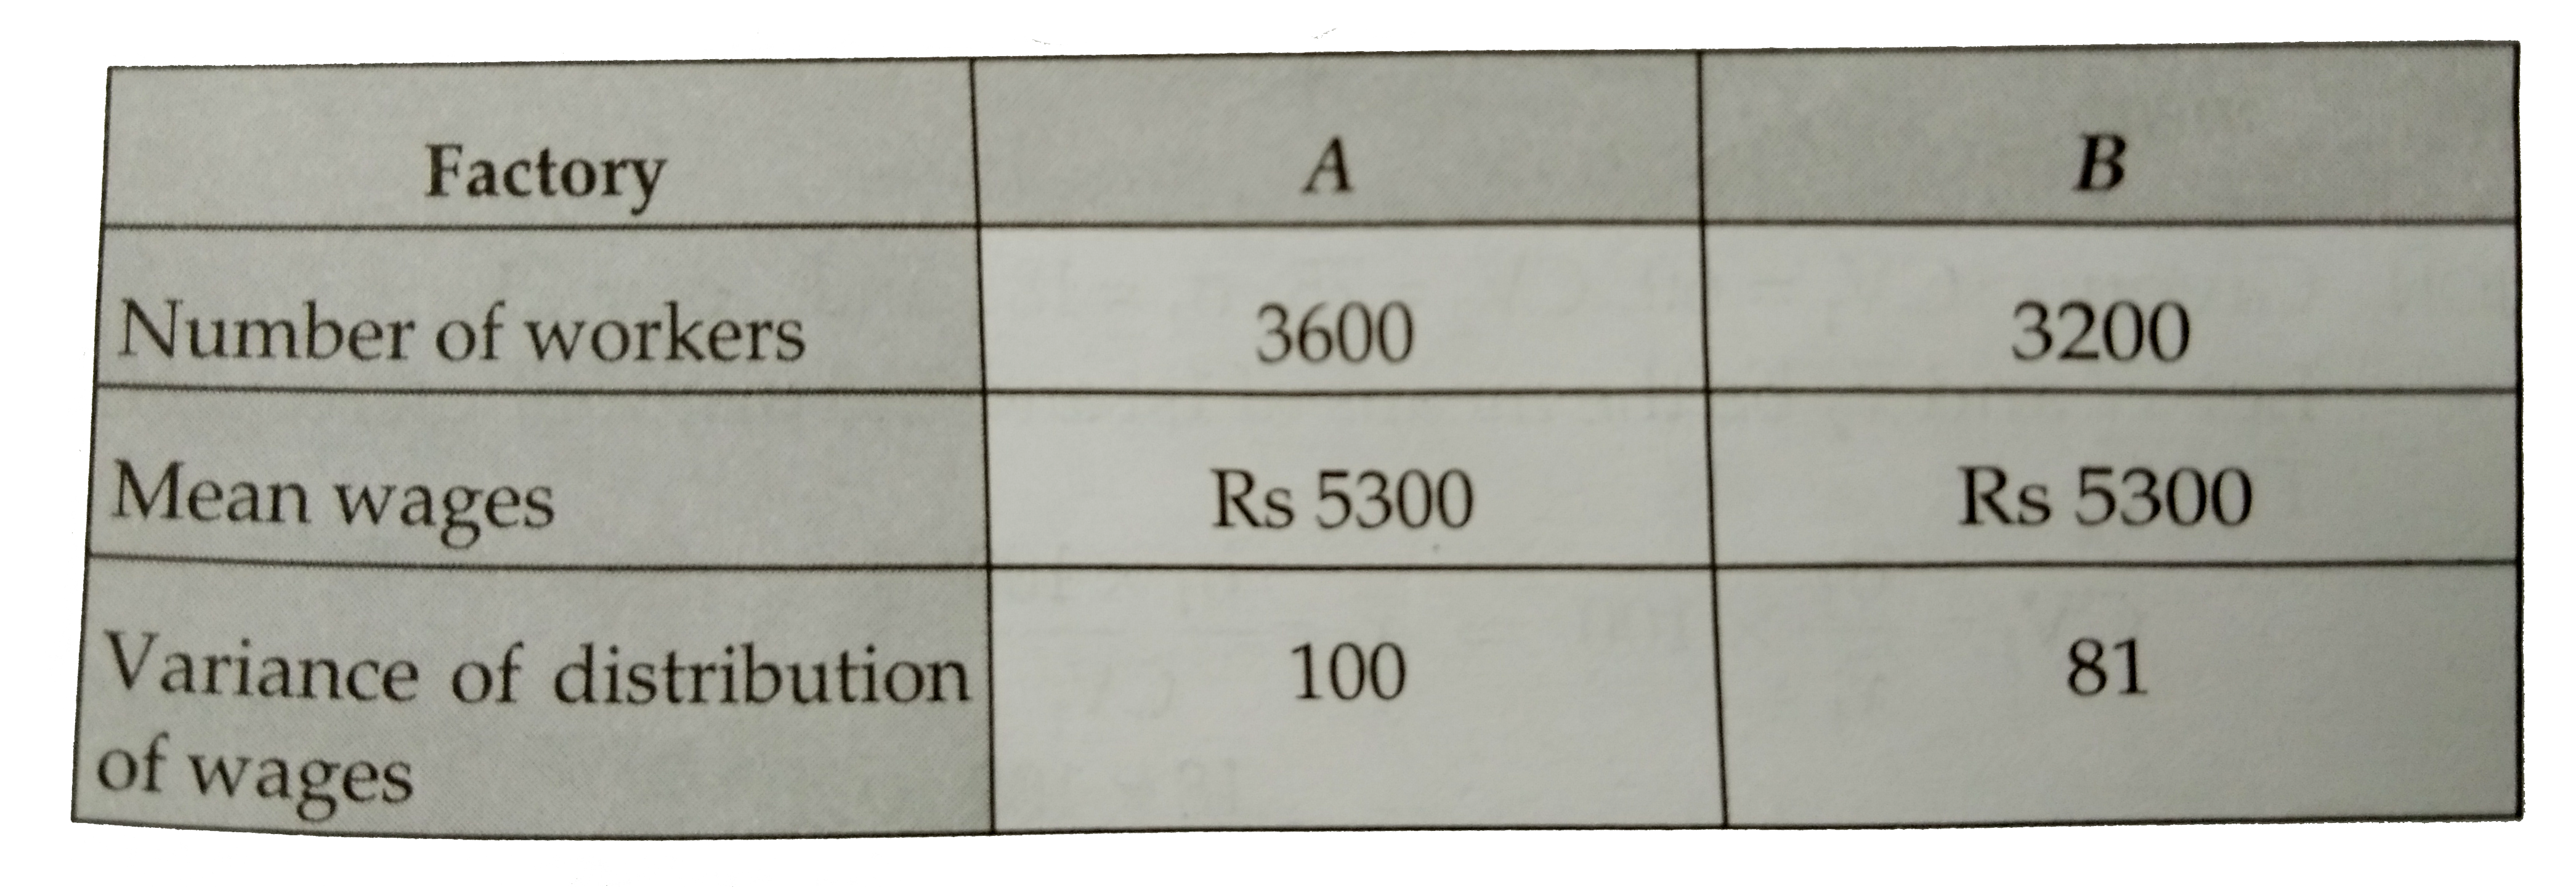
Which factory has more variation in wages?
The correct Answer is:A
Step by step video & image solution for The following results show the number of workers and the wages paid to them in two factories F_(1) and F_(2). Which factory has more variation in wages? by Maths experts to help you in doubts & scoring excellent marks in Class 11 exams.
Updated on:21/07/2023Topper's Solved these Questions
Similar Questions
Two plants A and B of a factory show following results about the number of workers and the wages paid to them.

In which plant, A or B is there greater variability in individual wages?
View SolutionTwo plants A and B of a factory show following results about the number of workers and the wages paid to them. Plant A Plant B No. of workers 5000 6000 Average monthly wages Rs. 2500 Rs. 2500 Variance of distribution of wages 81 100 In which plant A or B is there greater variability in individual wages?
View Solution
Knowledge Check
The average of daily wages for the workers of the two factories combined is
 A2⋅22B3⋅15C4.10Dnone of these
The following bar graph shows me sales (in thousands) of motor bikes by the factories, F1,F2, F3 and F4 in 2017, 2018 and 2019.
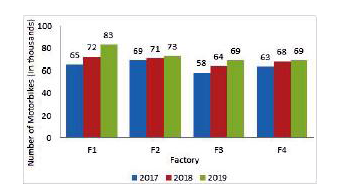
Which factory had the least number of sales across all the years?AF1BF3CF2DF4The following bar graph shows the sales (in thousands J of motor bikes bv the factories, F1, F2, F3 and F4 in 2017, 2018 and 2019.
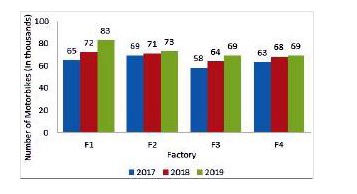
Which factory had the lushest sales across all the years?AF3BFlCF4DF2
An analysis of monthly wages paid to workers intwo firms A and B, belonging to the same industry, gives the following results:

(i) Which firm A or B pays larger amount as monthly wages?
(ii) Which firm A or B shows greater variability in individual wages?
View SolutionThe following graph shows the production of cement (in lakh tons) of four factories A, B, C and D over the years
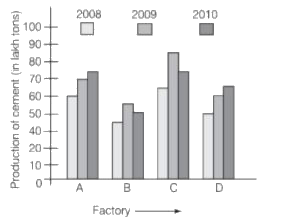
Which of the four factories has recorded the maximum percentage growth in production of cement from 2008 to 2009 ?
View SolutionThe following graph shows the production of cement (in lakh tons) of four factories A, B, C and D over the years
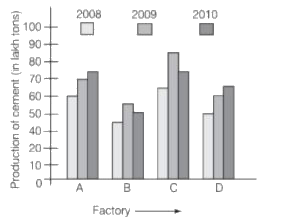
Which of the given factories has recorded the maximum percentage growth in production of cement from 2009 to 2010 ?
View SolutionThe following table gives the weekly wage of workers in a factory:

Find the (i) mean (ii) modal class (iii) the mode.
View SolutionThe following bar staph shows the sales (in thousands) of motor bikes bv the factories, F1, F2, F3 and F4 in 2017, 2018 and 2019.
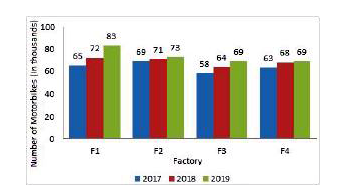
What is the ratio of total sales of Fl to that of F4 across all years?
View Solution
