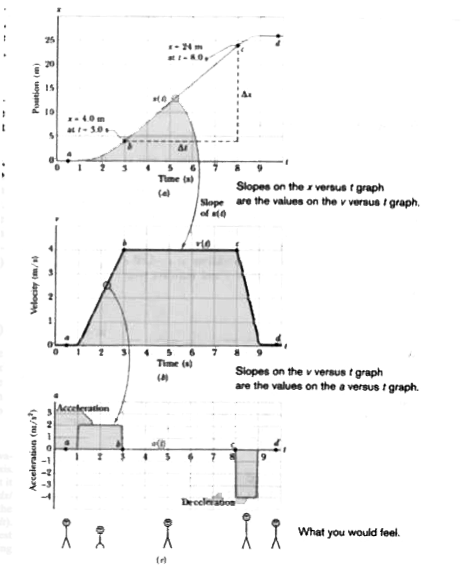
Figure 2-6a is an x(t) plot for an elevator cab that is initially stationary, then moves upward ( which we take to be the positive direction of x ), and then stops. Plot v(t).

KEY IDEA
We can find the velocity at any time from the slope of the x(t) curve at that time.
Calculations : The slope of x(t), and so also the velocity, is zero in the intervals from 0 to 1 s and from 9 s on, so then the cab is stationary. During the interval bc, the slope is constant and nonzero, so then the cab moves with constant velocity . We calculate the slope of x(t) then as
ΔxΔt=v=24m−4.0m8.0s−3.0s
=+4.0m/s (2-5)
The plus sign indicates that the cab is moving in the positive x direction. These intervals ( where v=0 and v=4 m/s) are plotted in Fig. 2-6 b. In addition, as the cab
Figure 2-6 (a) The x(t) curve for an elevator cab that moves upward along an x axis. (b) The v(t) curve for the cab. Note that it is the derivative of the x(t) curve ( v=dx/dt). (c) The a(t) curve for the cab . It is the derivative of the v(t) curve ( a = dv/dt). The stick figures along the bottom suggest how a passenger.s body might feel during the accelerations.
initially beging to move and then later slows to a stop, v varies as indicated in the intervals 1 s to 3 s and 8 s to 9s. Thus, Fig. 2-6 b is the required plot. ( Figure 2-6c is considered in Section 2.6 )
Given a v(t) graph such as Fig. 2-6 b, we could " work backward" to produce the shape of the associated x(t) graph (Fig. 2-6a). However, we would not know the actual values for x at various times, because the v(t) graph indicates only changes in x. To find such a change in x during any interval, we must, in the language of calculus, calculate the area " under the curve" on the v(t) graph for the that interval. For example, during the interval 3 s to 8 s in which the cab has a velocity of 4.0 m/s. the change in x is
Δx=(4.0m/s)(8.0s−3.0s)=+20m. (2-6)
(The area is positive because the v(t) curve is above the t axis. ) Figure 2-6a shows that x does indeed increase by 20 m in that interval. However, Fig. 2-6 b does not tell us the values of x at the beginning and end of the interval. For that, we need additional information, such as the value of x at some instant.
Topper's Solved these Questions
- MOTION ALONG A STRAIGHT LINEBOOK - RESNICK AND HALLIDAYCHAPTER - MOTION ALONG A STRAIGHT LINEEXERCISE - SAMPLE PROBLEM 2.05
1 Videos
- MOTION ALONG A STRAIGHT LINEBOOK - RESNICK AND HALLIDAYCHAPTER - MOTION ALONG A STRAIGHT LINEEXERCISE - SAMPLE PROBLEM 2.06
1 Videos
- MOTION ALONG A STRAIGHT LINEBOOK - RESNICK AND HALLIDAYCHAPTER - MOTION ALONG A STRAIGHT LINEEXERCISE - SAMPLE PROBLEM 2.04
2 Videos
- MAGNETIC FORCEBOOK - RESNICK AND HALLIDAYCHAPTER - MAGNETIC FORCEEXERCISE - Practice Questions (Integer type )
7 Videos
- MOTION IN TWO AND THREE DIMENSIONSBOOK - RESNICK AND HALLIDAYCHAPTER - MOTION IN TWO AND THREE DIMENSIONSEXERCISE - PRACTICE QUESTIONS (MATRIX-MATCH)
10 Videos
Similar Questions
A spring block (force constant k=1000N/m and mass m=4kg) system is suspended from the ceiling of an elevator such that block is initially at rest. The elevator begains to move upwards at t=0. Acceleration tome graph of the elevator is shown in the figure. Draw the displacement X (from its initial position taking upwards as positive) vs time graph of the block with respect to the elevator starting from t=0 to t=1sec. Take π2=10.

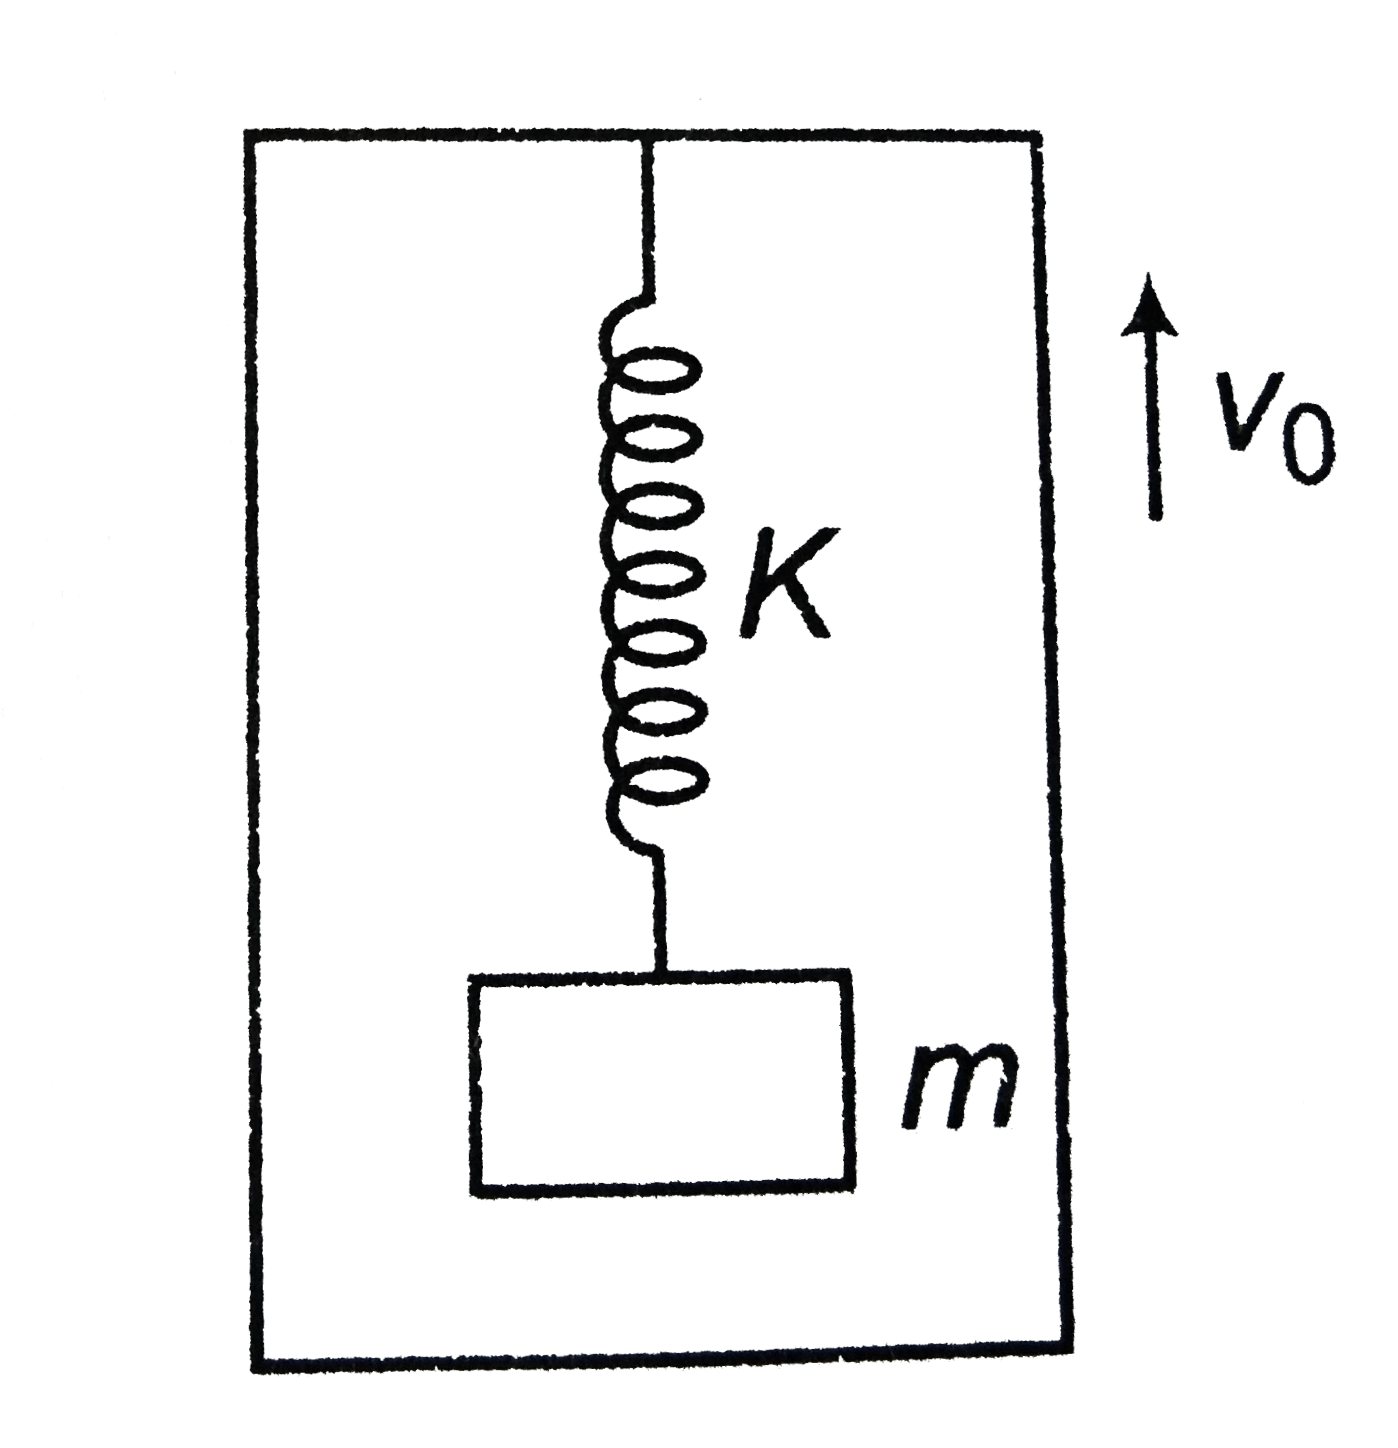
View SolutionA spring block system is kept inside a lift moving with a constant velocity v0 as shown in figure. Block is in equilibrium and at rest with respect to lift. The lift is suddenly stopped at time t=0. Taking upward direction as the positive direction, write x−t equation of the block.

View Solution
Knowledge Check
A ball is dropped from an elevator moving upward with acceleration 'a' by a boy standing in it. The acceleration of ball with respect to [Take upward direction positive]
ABoy is - gBBoy is −(g+a)CGround is −gDBoth (2) & (3)
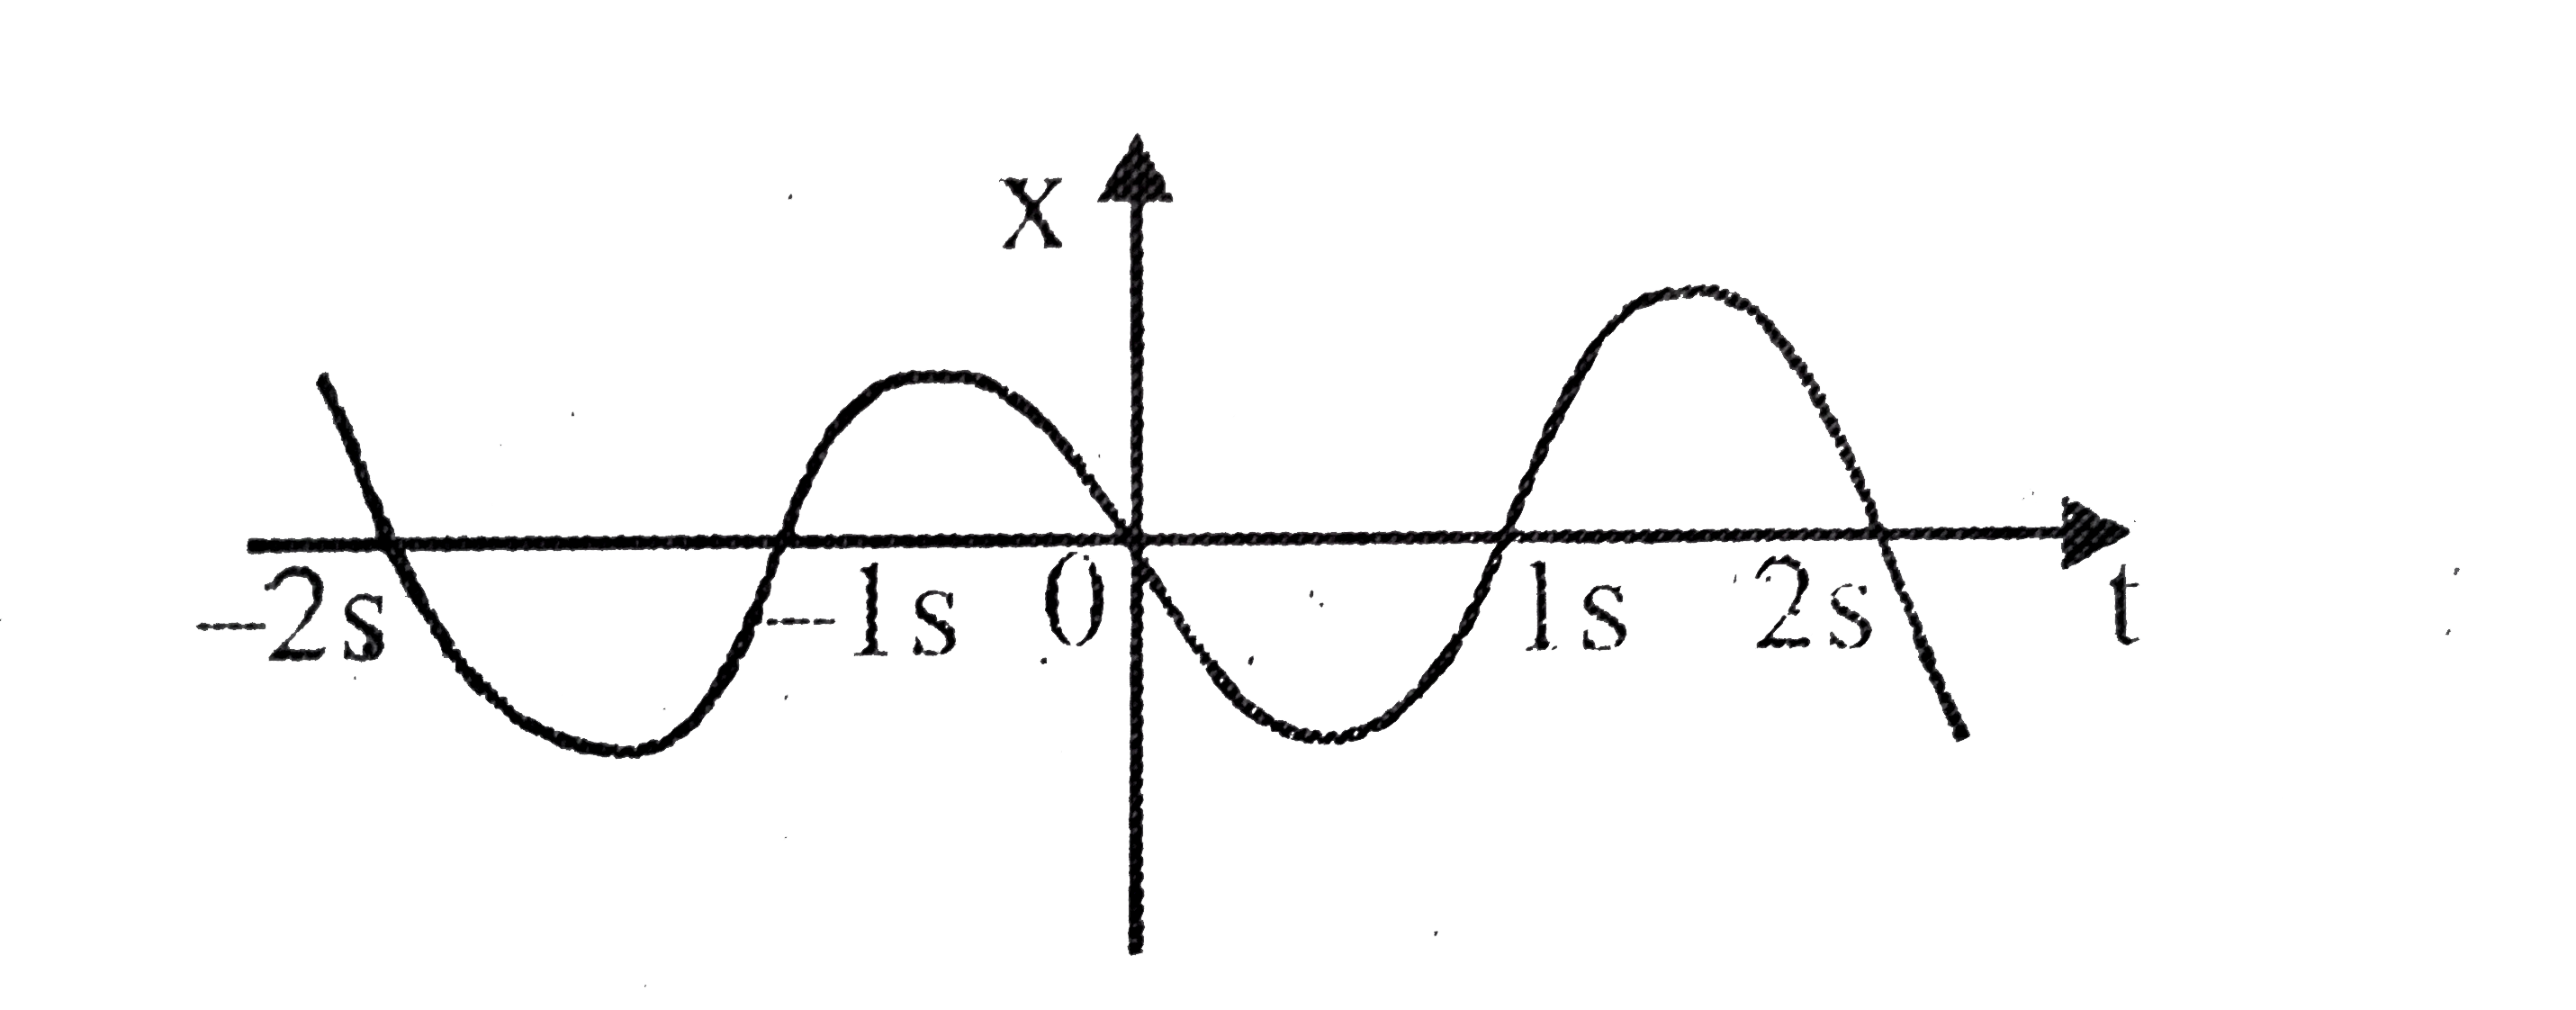
Figure gives the x-t plot of a particle is one dimensional motion. Give the signs of position, velocity and acceleration of the particle at t = 0.3s

View SolutionA spring block system is kept inside a lift moving with a constant velocity v0 as shown in figure. Block is in equilibrium and at rest with respect to lift. The lift is suddenly stoped at time t=0. Taking upward direction as the positive direction, write x−t equation of the block.
View SolutionA particle is moving along positive x direction and experiences a constant acceleration of 4m/s2 in negative x direction. At time t=3 second its velocity was observed to be 10m/s in positive x direction.
(a) Find the distance travelled by the particle in the interval t=0 to t=3s. Also find distance travelled in the interval t=0 to t=7.5s..
(b) Plot the displacement – time graph for the interval t=0 to 7.5s.
View SolutionA ball is dropped from an elevator moving upward with acceleration 'a' by a boy standing in it. The acceleration of ball with respect to [Take upward direction positive]
View SolutionFigure shows the x-t plot of a particle moving along a straight line. Let v1 and v2, be average speeds in time intervals 1 and 2 respectively. Then

View SolutionA person standing oin the floor of an elevator drops as coin. The coin reaches the floor of the elevator in a time t1 if the elevator is stationary and in the t2 if it is moving uniformly. Then
View SolutionA person standing oin the floor of an elevator drops as coin. The coin reaches the floor of the elevator in a time t1 if the elevator is stationary and in the t2 if it is moving uniformly. Then
View Solution
