A body is thrown vertically upwards. Which one of the following graphs correctly represent the velocity vs time?
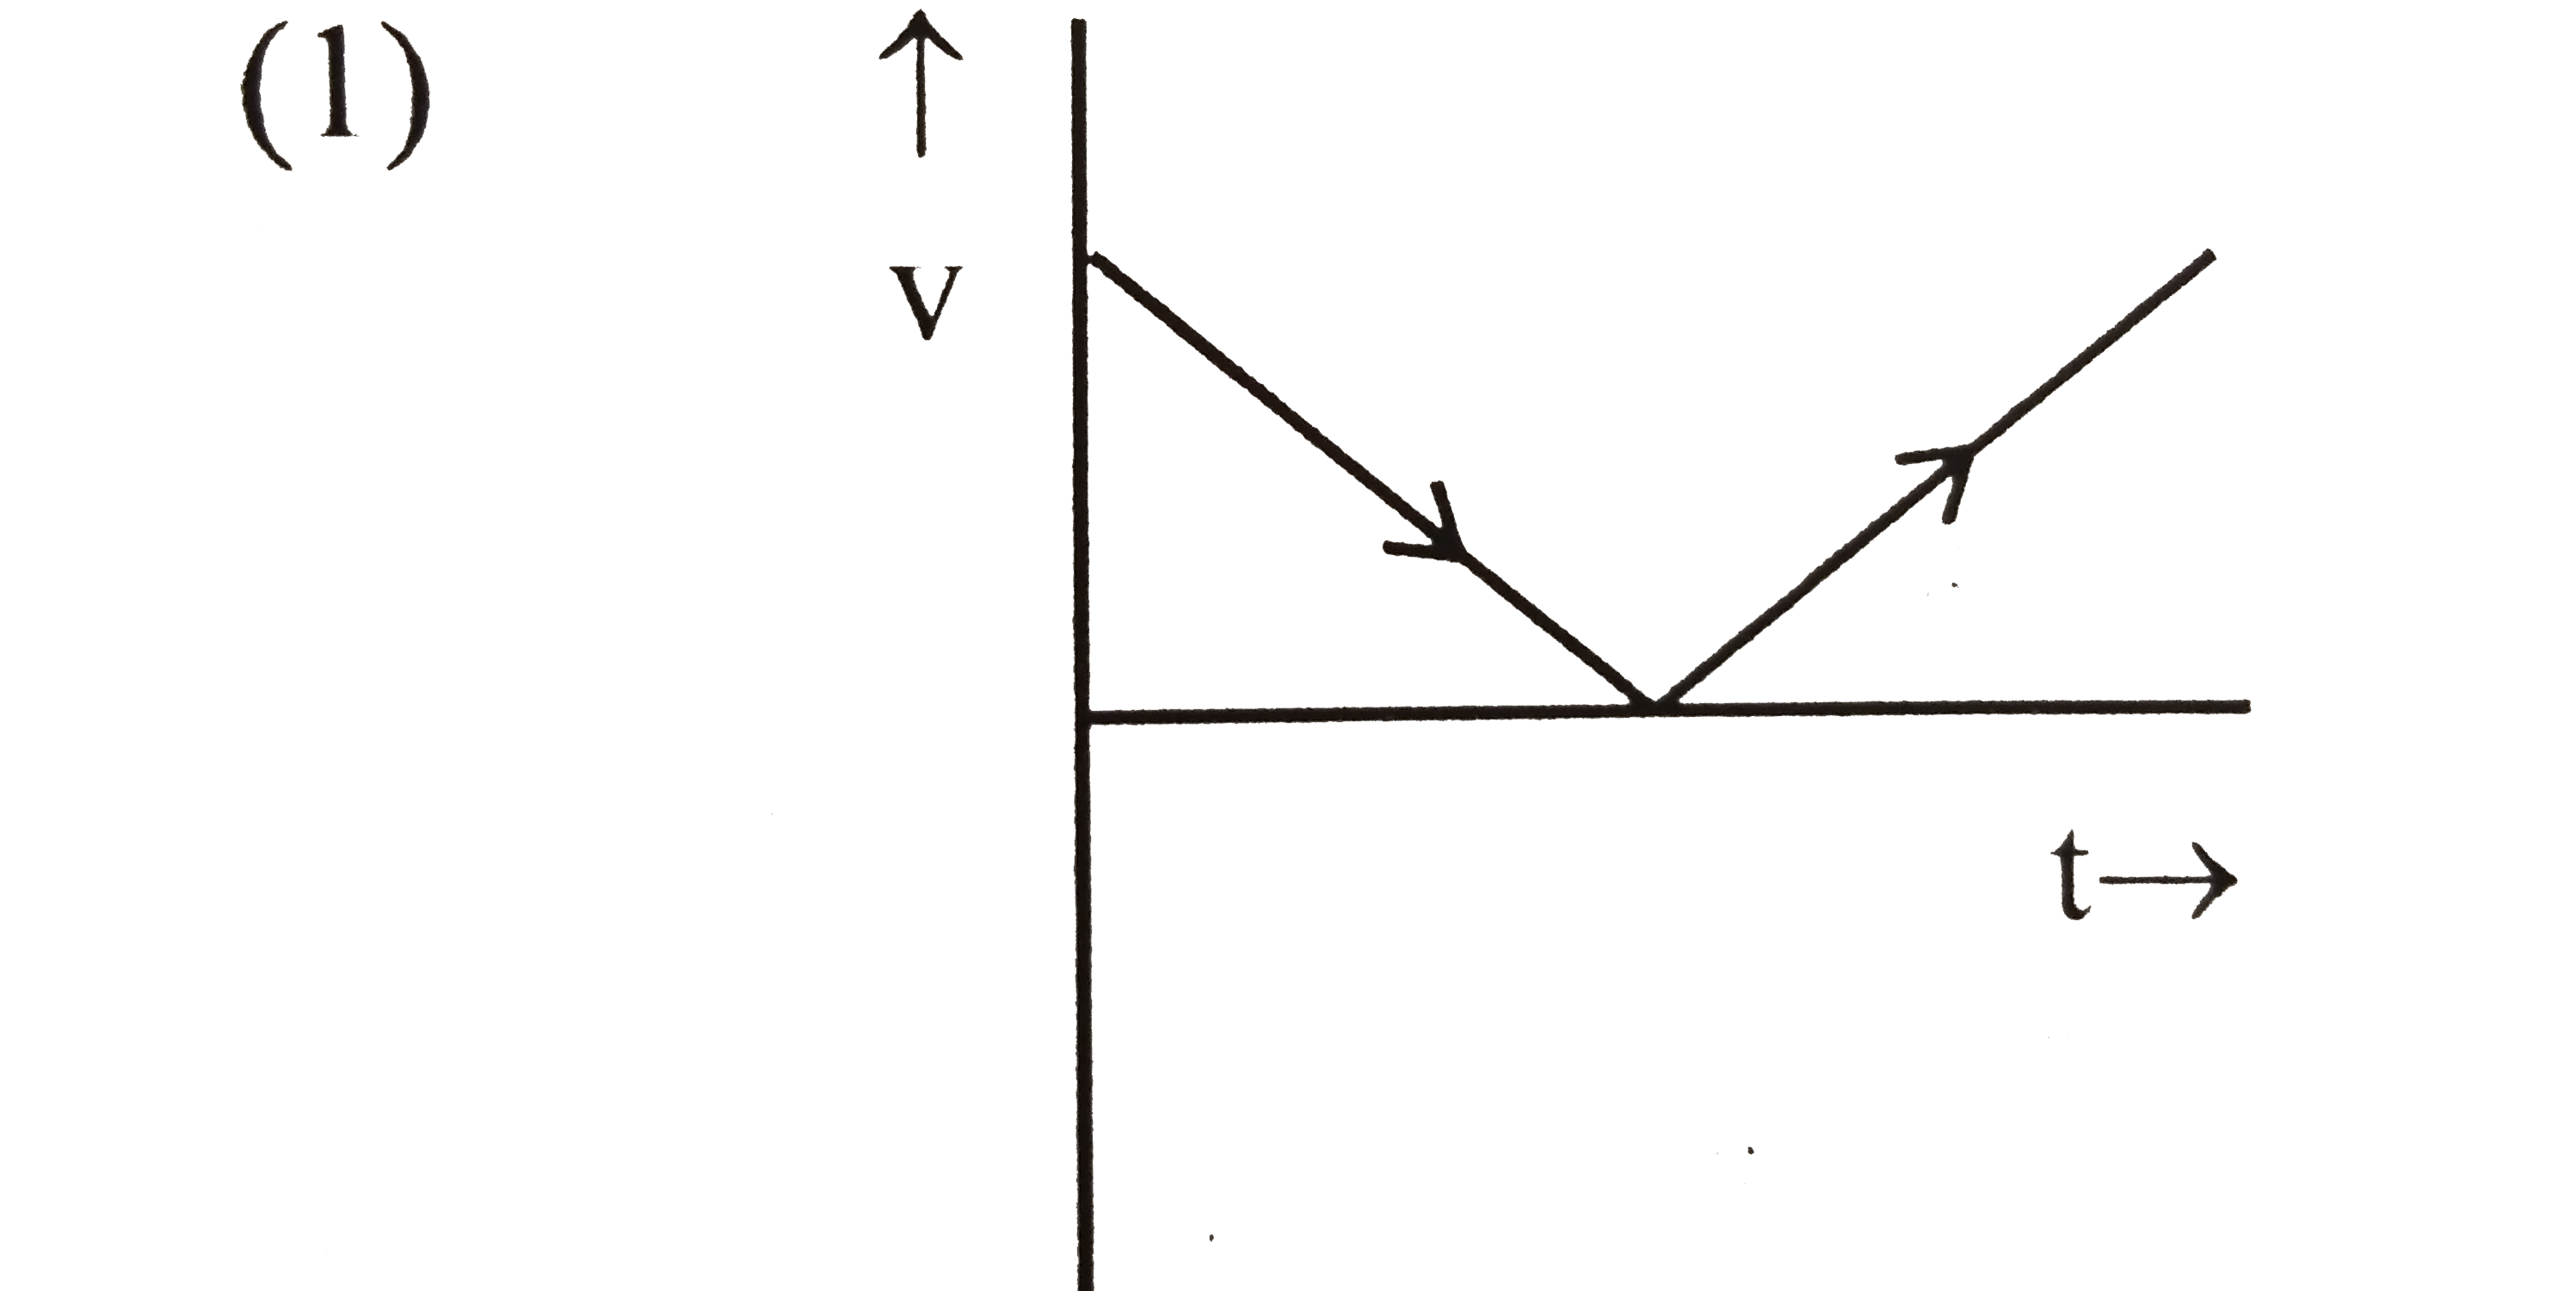
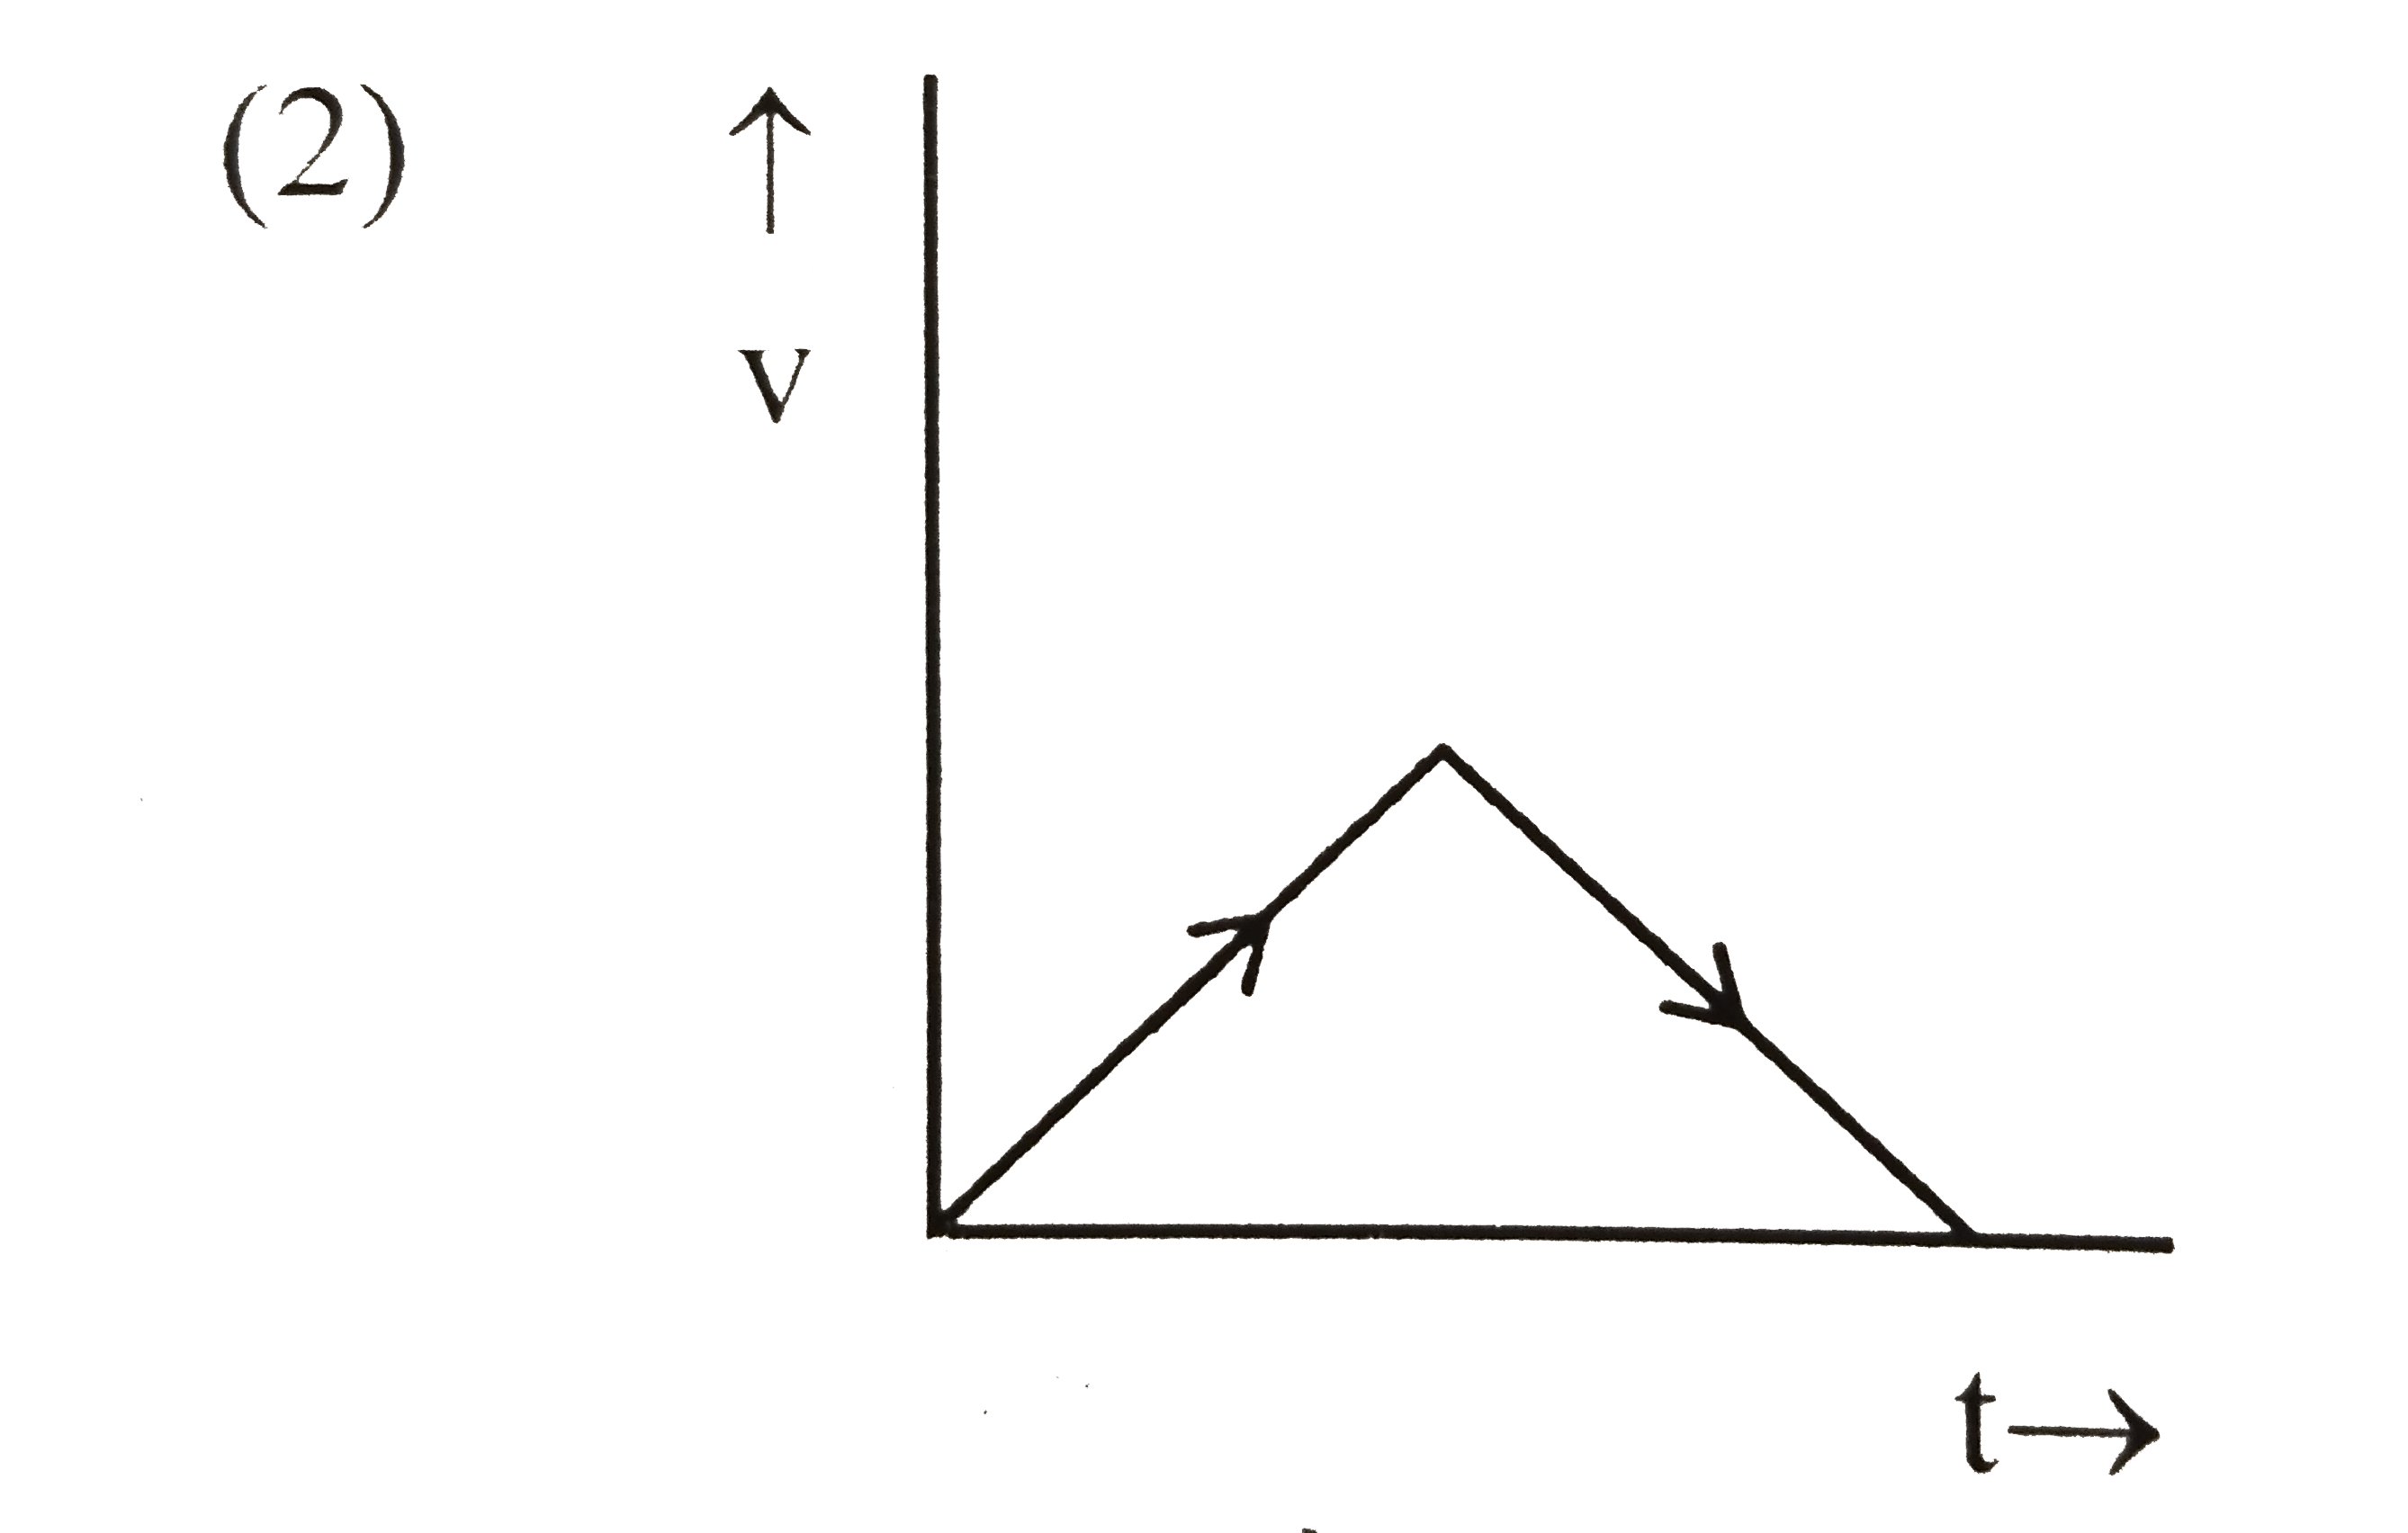
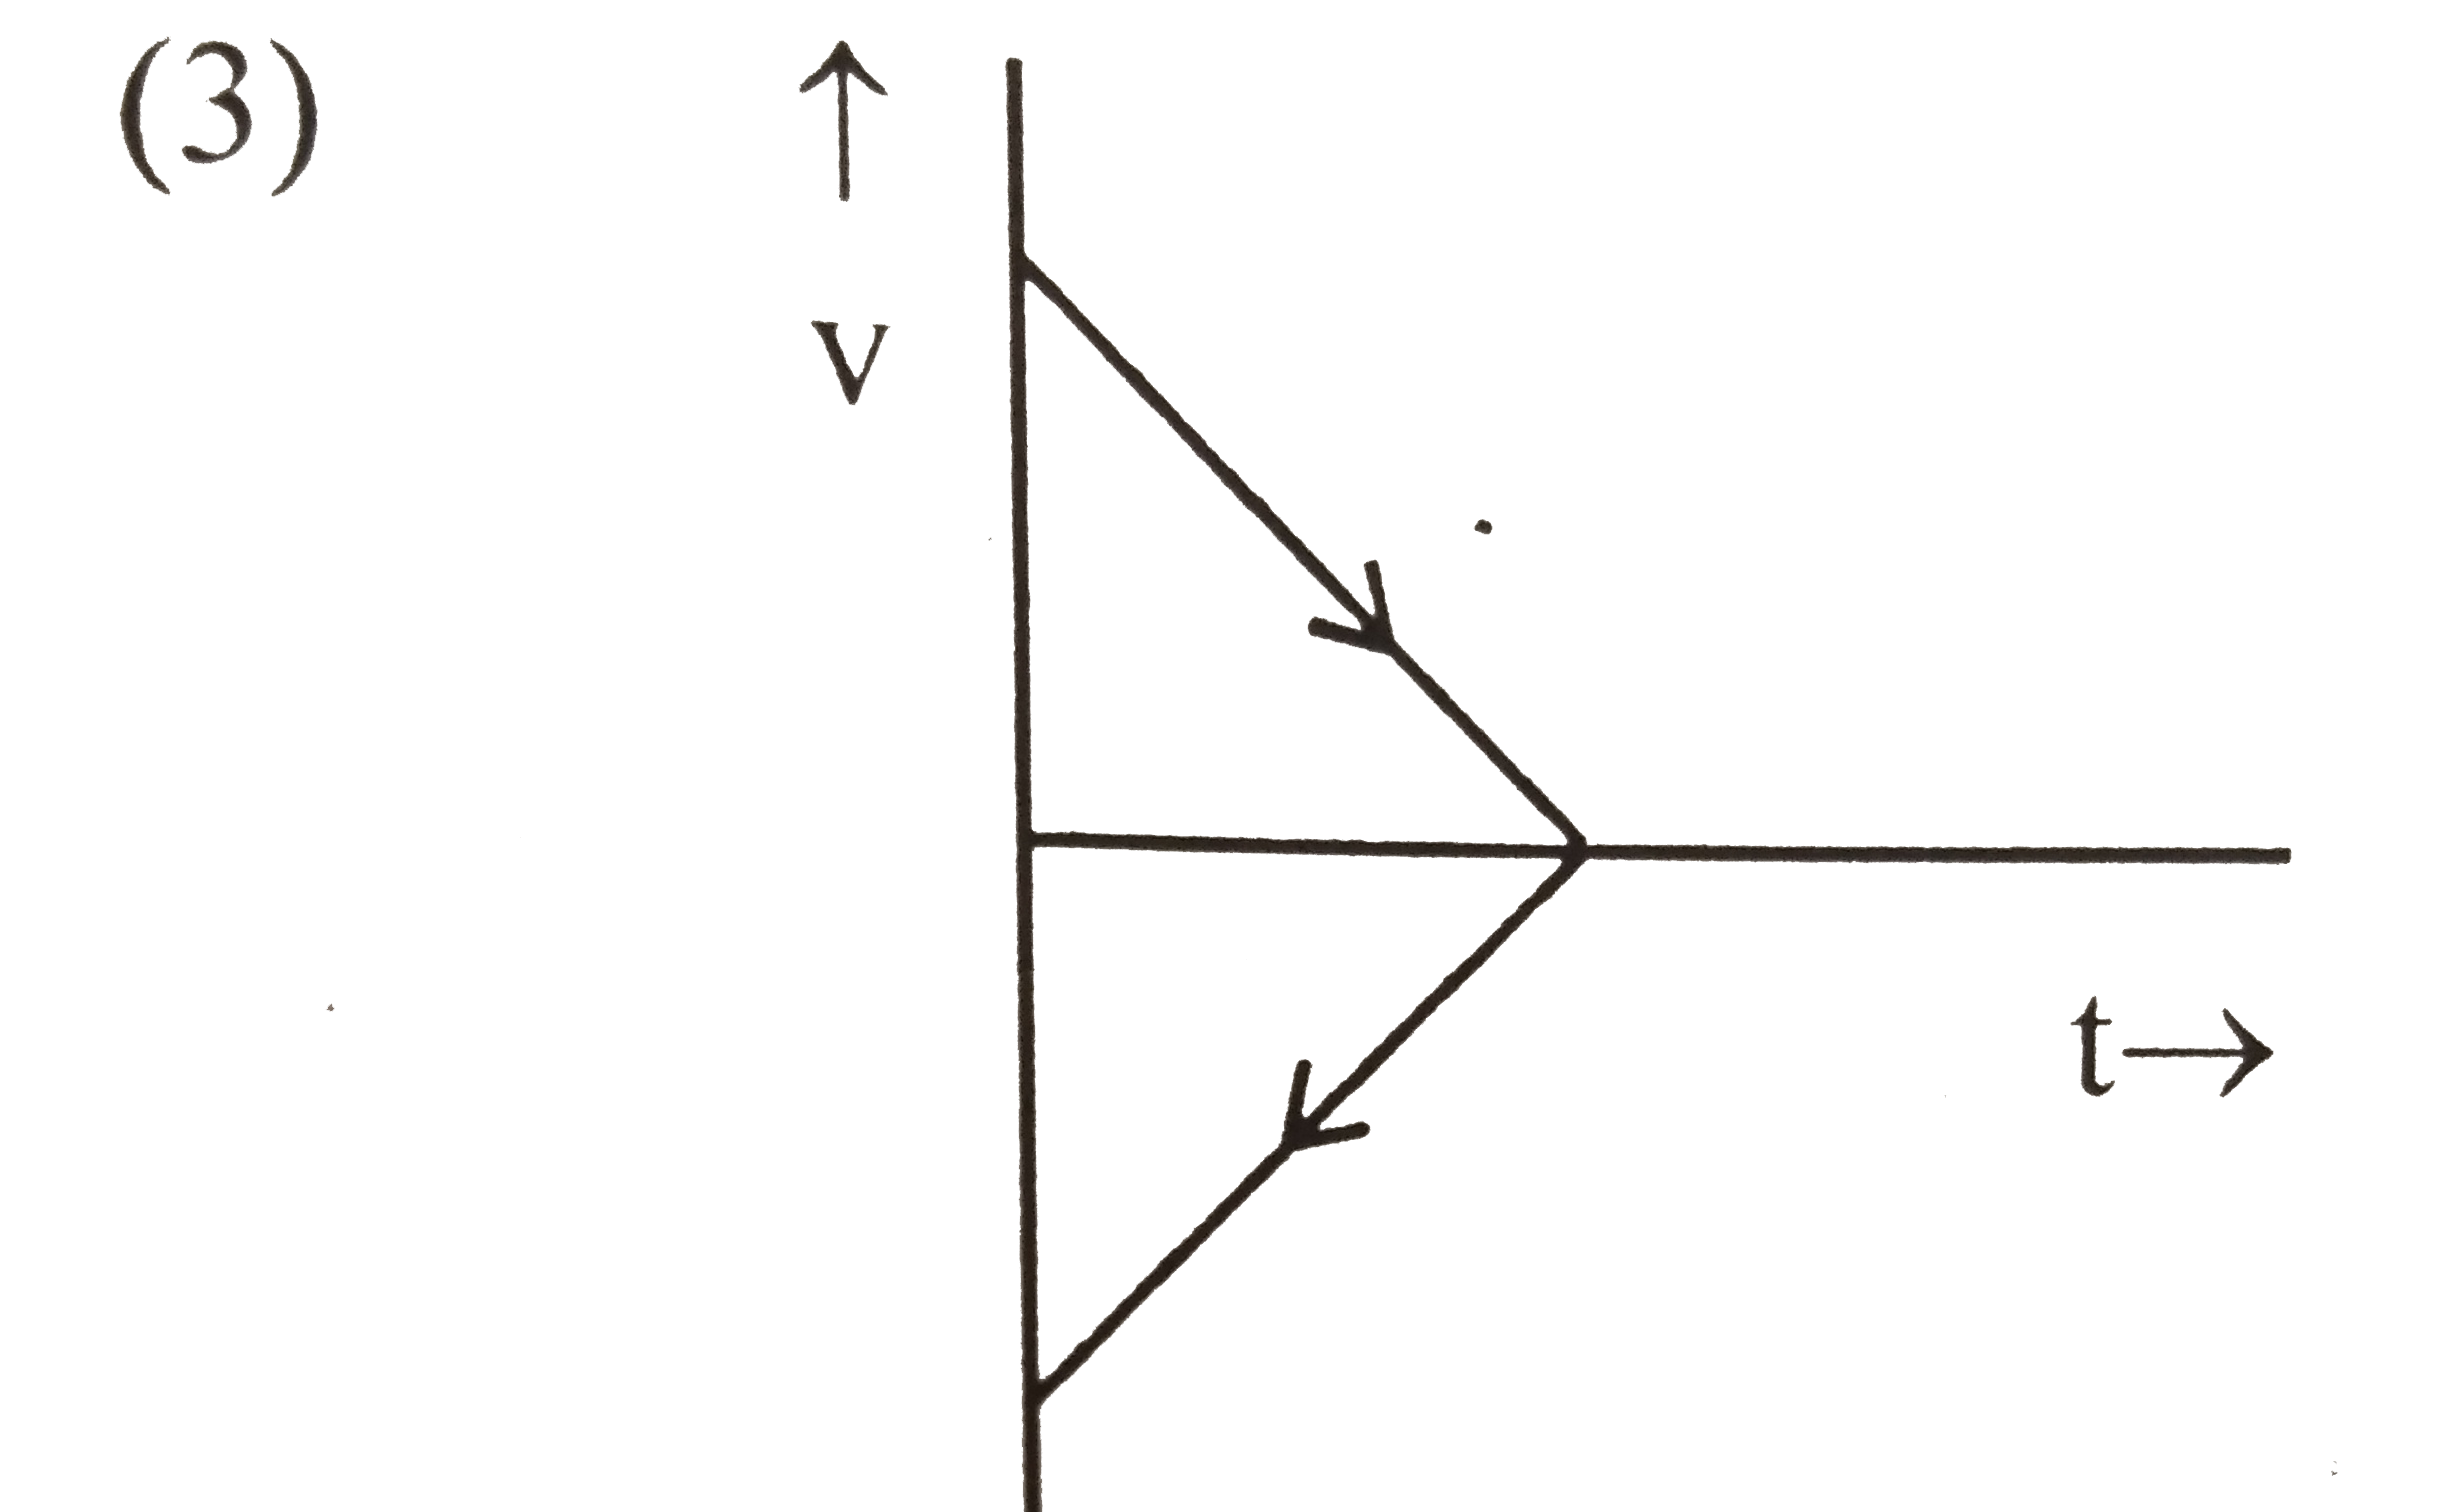
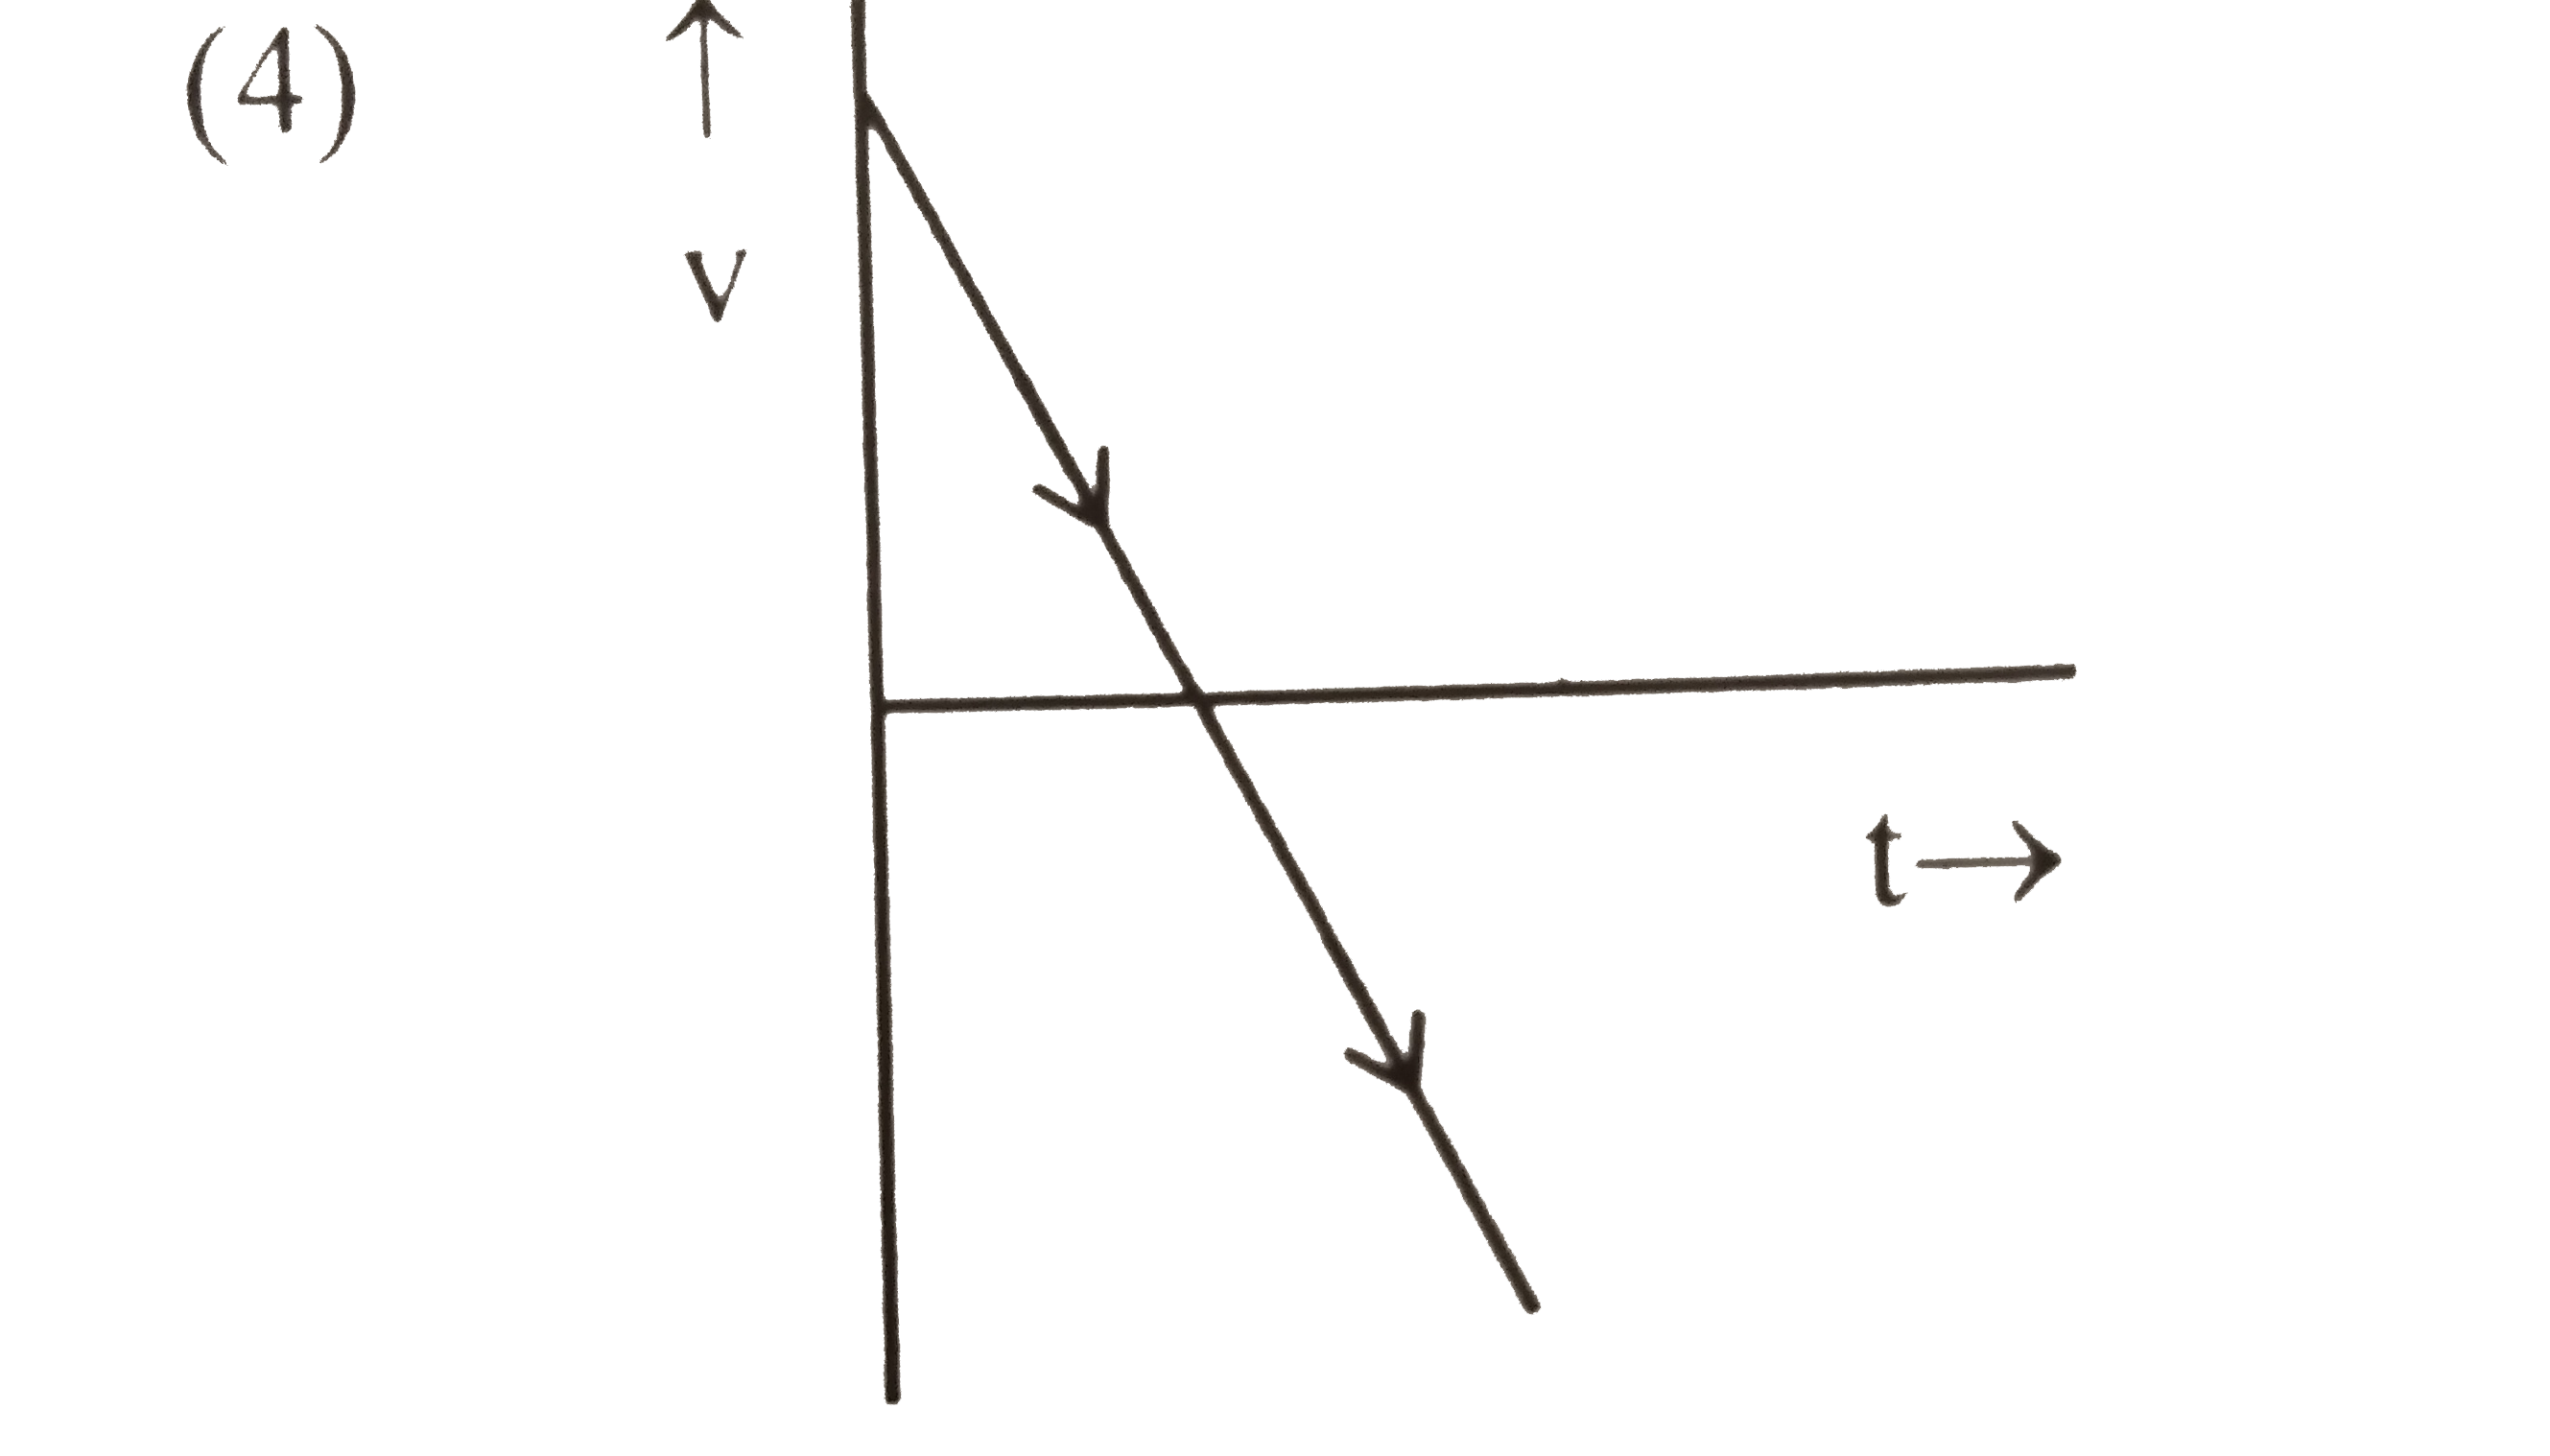
The correct Answer is:D
To solve the problem of determining the correct graph for velocity vs time for a body thrown vertically upwards, we can follow these steps:
Step 1: Understand the motion of the body
When a body is thrown vertically upwards, it initially moves upward with a certain velocity (let's denote this initial velocity as v0). As it rises, it experiences a downward acceleration due to gravity, which is approximately g=9.81m/s2.
Step 2: Write the equation of motion
The equation relating velocity, initial velocity, acceleration, and time is given by:
v=v0−gt
Here, v is the velocity at time t, v0 is the initial velocity, and g is the acceleration due to gravity (which is negative in this case because it acts downward).
Step 3: Analyze the equation
From the equation v=v0−gt:
- At t=0, v=v0 (the initial velocity).
- As time t increases, the term −gt becomes larger, causing the velocity v to decrease.
- Eventually, the velocity will reach zero at the peak of the motion (when the body stops rising).
- After reaching the peak, the velocity will become negative as the body starts to fall back down.
Step 4: Determine the shape of the graph
The graph of velocity vs time will be a straight line:
- It starts at v0 (positive value) when t=0.
- It has a negative slope because the velocity decreases at a constant rate (due to constant acceleration).
- The line will intersect the time axis (velocity = 0) at some point, after which the velocity will be negative as the body falls back down.
Step 5: Identify the correct graph
Based on the analysis above, the correct graph will be a straight line starting from a positive value (initial velocity) and sloping downwards to cross the time axis (zero velocity) and then continuing into the negative region (negative velocity) as time progresses.
Conclusion
The correct graph that represents the velocity vs time for a body thrown vertically upwards is a straight line with a negative slope, starting from a positive value and crossing the time axis.
When a body is thrown vertically upwards, it initially moves upward with a certain velocity (let's denote this initial velocity as v0). As it rises, it experiences a downward acceleration due to gravity, which is approximately g=9.81m/s2.
The equation relating velocity, initial velocity, acceleration, and time is given by:
v=v0−gt
Here, v is the velocity at time t, v0 is the initial velocity, and g is the acceleration due to gravity (which is negative in this case because it acts downward).
From the equation v=v0−gt:
- At t=0, v=v0 (the initial velocity).
- As time t increases, the term −gt becomes larger, causing the velocity v to decrease.
- Eventually, the velocity will reach zero at the peak of the motion (when the body stops rising).
- After reaching the peak, the velocity will become negative as the body starts to fall back down.
The graph of velocity vs time will be a straight line:
- It starts at v0 (positive value) when t=0.
- It has a negative slope because the velocity decreases at a constant rate (due to constant acceleration).
- The line will intersect the time axis (velocity = 0) at some point, after which the velocity will be negative as the body falls back down.
Based on the analysis above, the correct graph will be a straight line starting from a positive value (initial velocity) and sloping downwards to cross the time axis (zero velocity) and then continuing into the negative region (negative velocity) as time progresses.
The correct graph that represents the velocity vs time for a body thrown vertically upwards is a straight line with a negative slope, starting from a positive value and crossing the time axis.
Topper's Solved these Questions
Similar Questions
A ball thrown vertically upward with initial velocity u. Which of the following graphs represent the velocity of ball correctly as function of time?
(Take upward direction as positive)View SolutionA ball is thrown vertically upwards. Which of the following plots represents the speed-time graph of the ball during its height if the air resistance is not ingnored ?
View Solution
Knowledge Check
- Question 1 - Select One
Which of the following graph is correctly represented?
A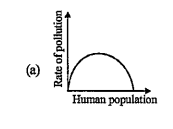 B
B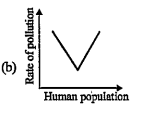 C
C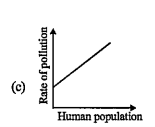 D
D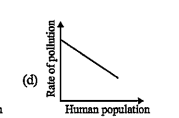
- Question 2 - Select One
A body nis thrown vertically upward. Which of the following graphs correctly/represents the velocity of the body with time?
A B
B C
C D
D
- Question 3 - Select One
A ball is thrown vertically upwards. Which of the following graph/graphs represent velocity time graph of the ball during its flight ( air resistance is neglected).
A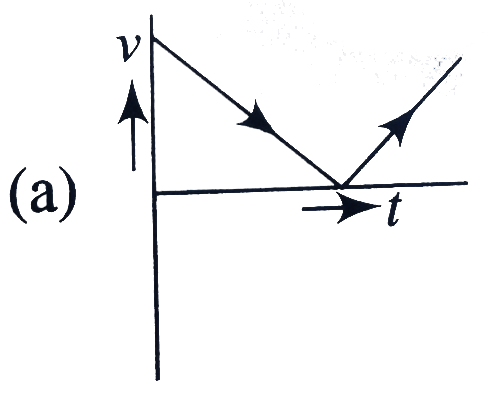 B
B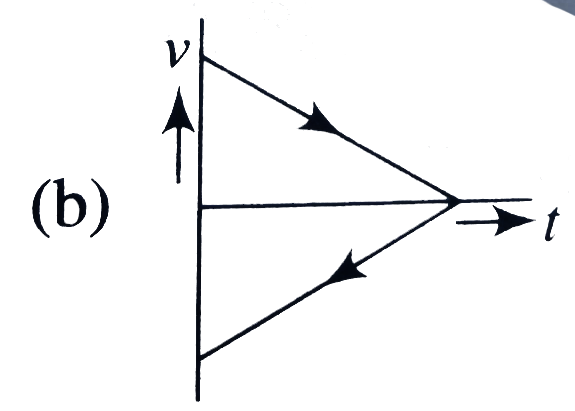 C
C D
D
A ball is thrown vertically upwards. Which of the following plots represent the speed graph of the ball during its flight if the air resistence is not ignored?
View Solutionwhich of the following graphs represents Charles' law correctly ?
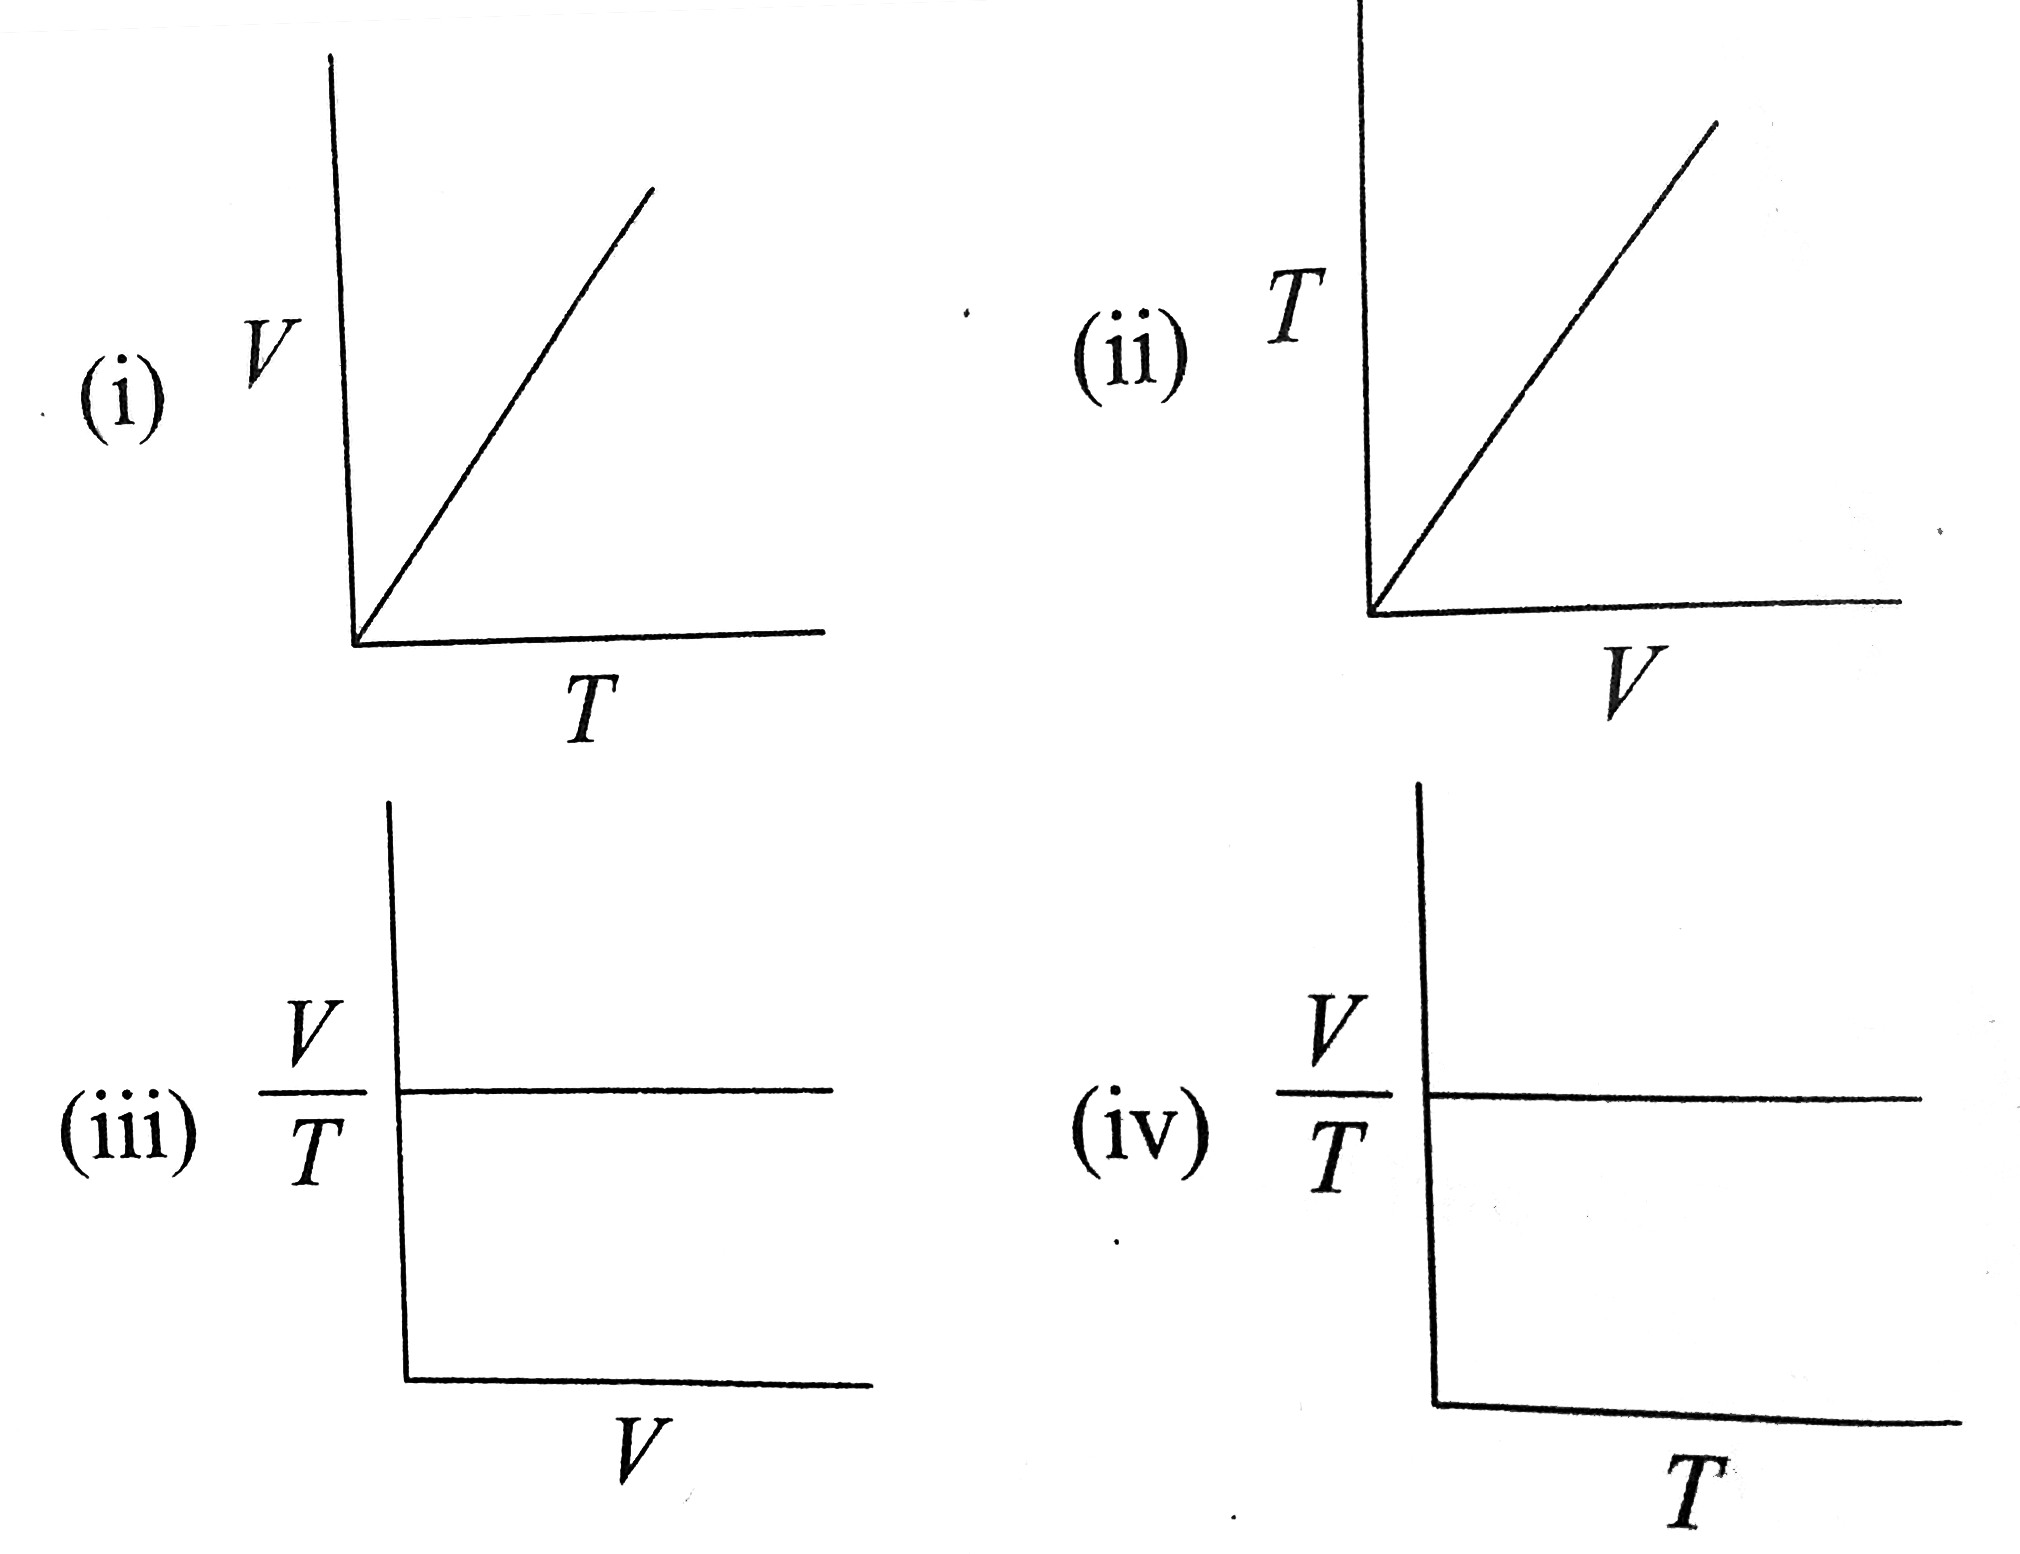 View Solution
The velocity -displacement graph of a particle is as shown in the figure. Which of the following graphs correctly represents the variation of acceleration with displacement?
 View Solution
The following graph represents the titration of pH vs volume
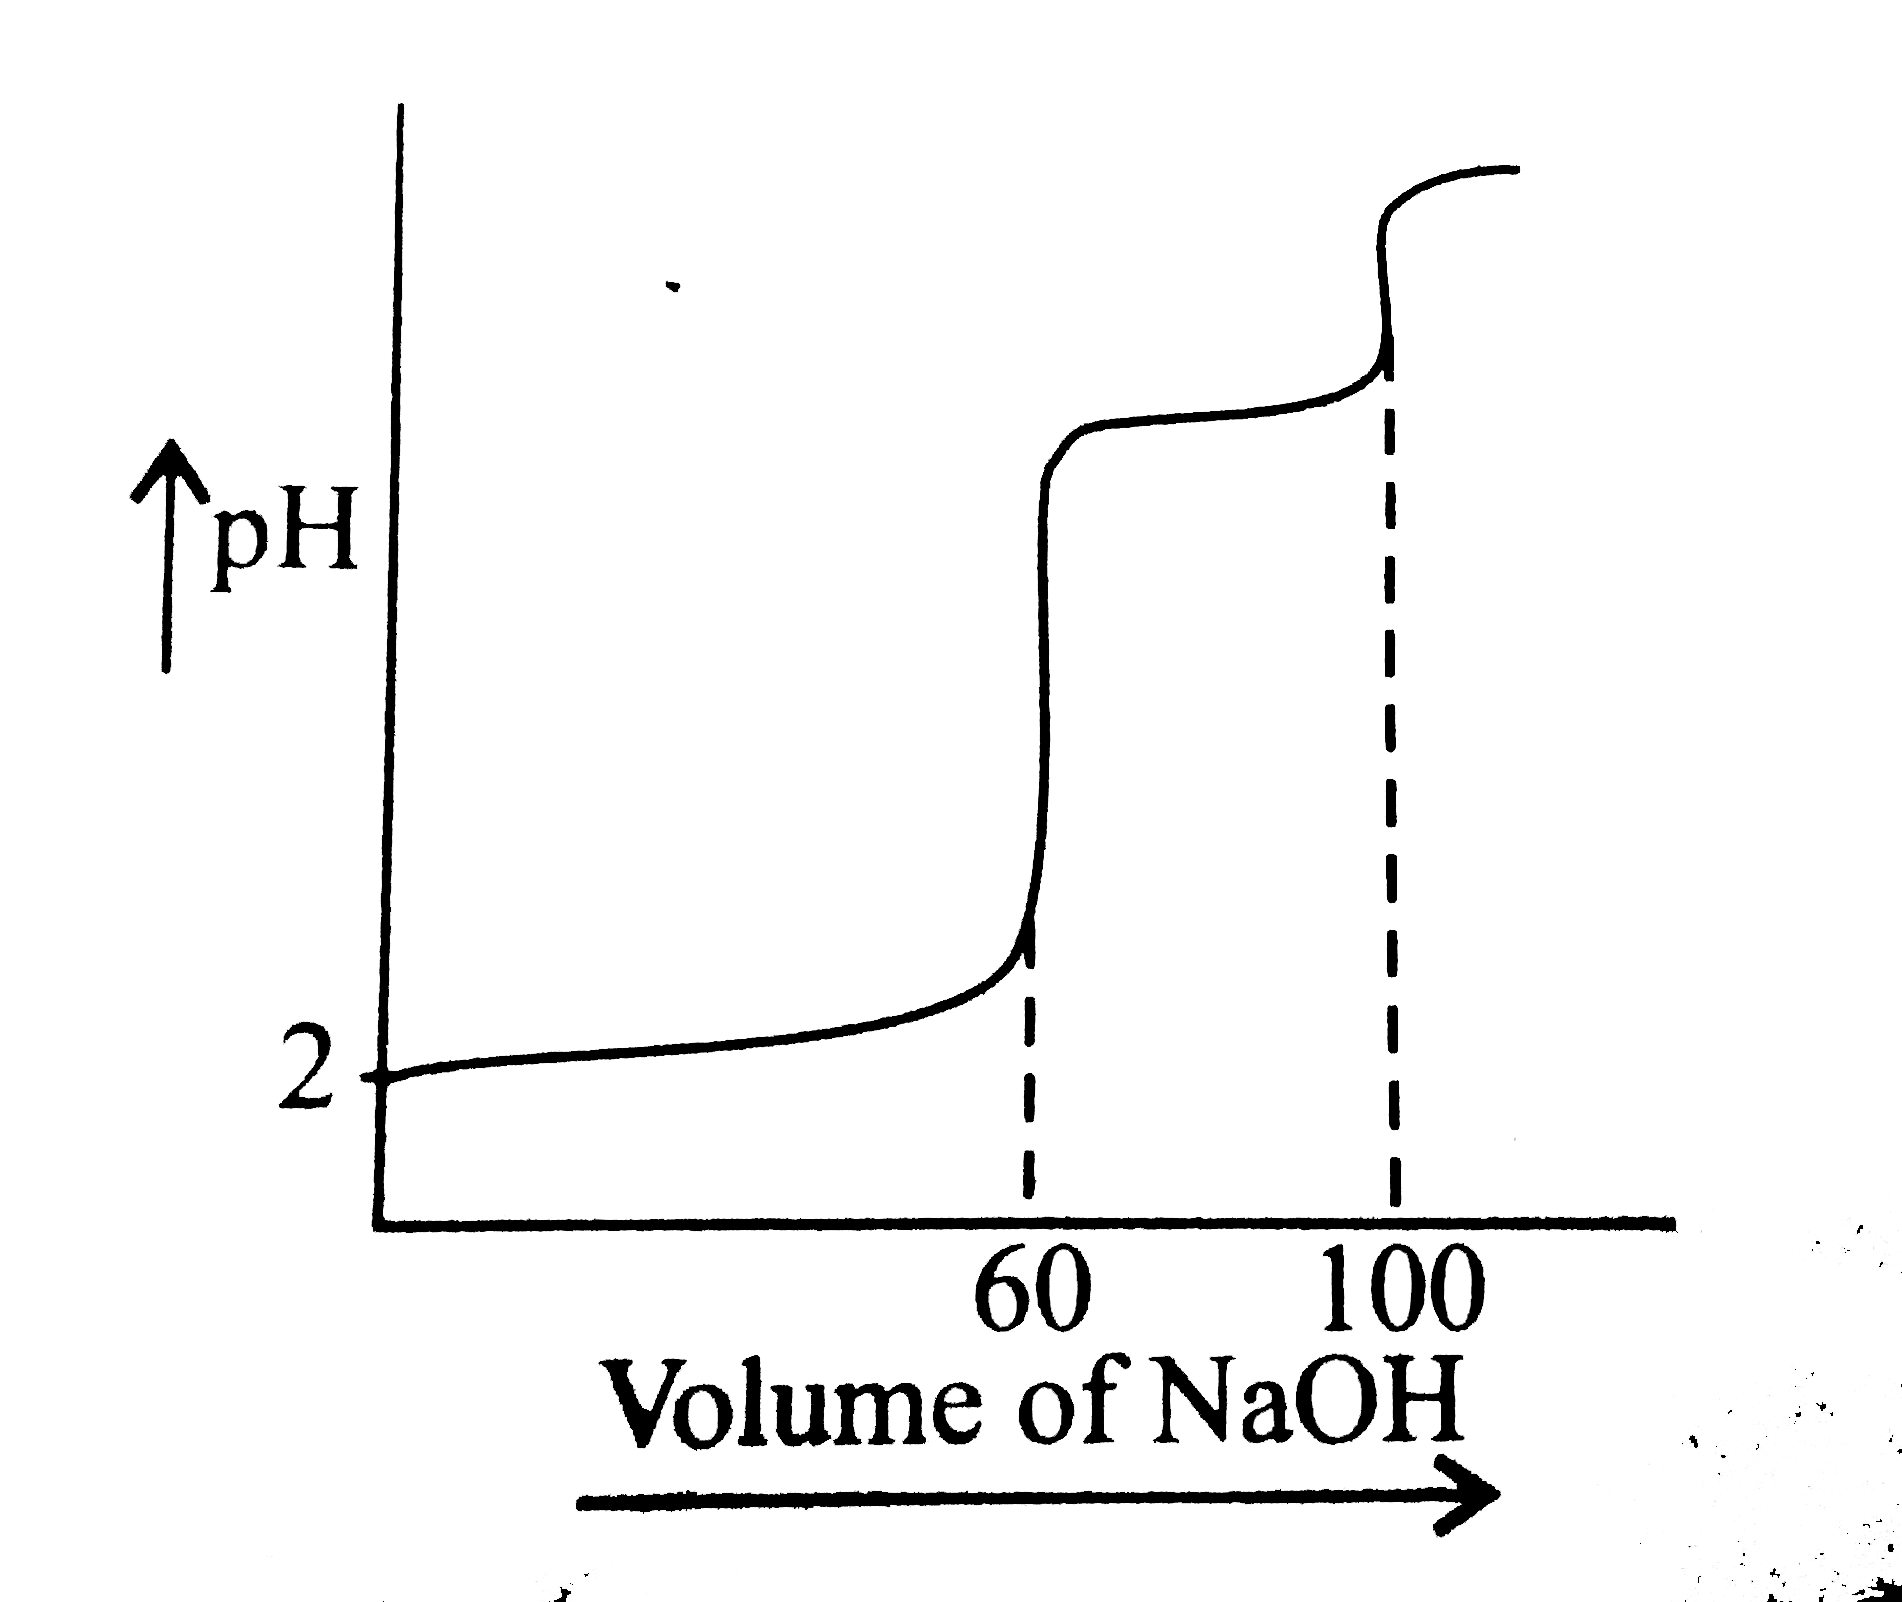 View Solution
A particle is thrown vertically upwards with a velocity v. It returns to the ground in time T. which of the following graphs correctly represents the motion ?
View Solution

