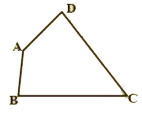
AB and CD are respectively the smallest and longest sides of aquadrilateral ABCD (see adjacent figure). Show that ∠A>∠Cand∠B>∠D.
 Solution in Telugu
Step by step video & image solution for AB and CD are respectively the smallest and longest sides of aquadrilateral ABCD (see adjacent figure). Show that /_A > /_C and /_ B > /_ D. by Maths experts to help you in doubts & scoring excellent marks in Class 9 exams.
Updated on:21/07/2023Topper's Solved these Questions
- TRIANGLES BOOK - NCERT TELUGUCHAPTER - TRIANGLES EXERCISE - DO THESE
3 Videos
- TRIANGLES BOOK - NCERT TELUGUCHAPTER - TRIANGLES EXERCISE - EXERCISE 7.1
11 Videos
- TRIANGLES BOOK - NCERT TELUGUCHAPTER - TRIANGLES EXERCISE - EXERCISE - 7.3
6 Videos
- THE ELEMENTS OF GEOMETRY BOOK - NCERT TELUGUCHAPTER - THE ELEMENTS OF GEOMETRY EXERCISE - BRAIN TEASER
2 Videos
Similar Questions
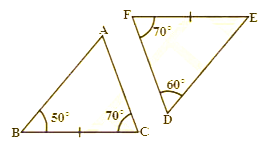
State whether the following triangles are congruent or not? Give reasons for your answer.

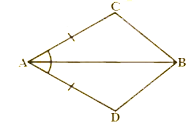
View SolutionIn quadrilateral ACBD,AC=ADandAB bisects ∠A Show that ΔABC≅ΔABD.
What can you say about BC and BD?

View SolutionAD is an altitude of an isosceles triangle ABC in which AB = AC. Show that, (i) AD bisects BC (ii) AD bisects ∠A.
View SolutionIn the figure x = ………..

View SolutionIn the given figure (not to scale), O is the centre of the circle. A,B,C and D are concyclic and AB=CD . If /_MON =120^(@) , then find /_ OPN .
View SolutionHow many lines of symmetry does the above figure have ?
View SolutionDetermine the point of symmetry of a regular hexagon.
View SolutionDtermine the images of the following figure about the given line :
View SolutionIn the figure above (not to scale), ¯¯¯¯¯¯AB⊥¯¯¯¯¯¯CDandAD is the bisector of ∠BAE.AB=3cm and AC=5cm. Find CD.
View SolutionMatch the following Column A to Column B

View SolutionMatch the following Column A to Column B

View SolutionMatch the following Column A to Column B

View SolutionThe inequation represented by the graph given below is :
View SolutionThe inequation that best describes the graph given below is _________
View SolutionThe inequation that best describes the following graph is _________
View Solution
