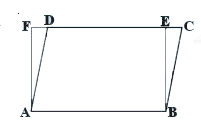
In the adjacent figure ABCD is a parallelogram ABEF is a rectangle show that ΔAFD≅ΔBEC.
 Solution in Telugu
Step by step video & image solution for In the adjacent figure ABCD is a parallelogram ABEF is a rectangle show that DeltaAFD~=DeltaBEC. by Maths experts to help you in doubts & scoring excellent marks in Class 9 exams.
Updated on:21/07/2023Topper's Solved these Questions
- QUADRILATERALSBook:NCERT TELUGUChapter:QUADRILATERALSExercise:EXERCISE - 8.3
Explore 9 Videos
- QUADRILATERALSBook:NCERT TELUGUChapter:QUADRILATERALSExercise:EXERCISE - 8.4
Explore 6 Videos
- QUADRILATERALSBook:NCERT TELUGUChapter:QUADRILATERALSExercise:EXERCISE - 8.1
Explore 10 Videos
- PROOFS IN MATHEMATICSBook:NCERT TELUGUChapter:PROOFS IN MATHEMATICSExercise:EXERCISE - 15.4
Explore 9 Videos
- REAL NUMBERSBook:NCERT TELUGUChapter:REAL NUMBERSExercise:Exercise 1.4
Explore 11 Videos
Similar Questions
The opposite angles of a parallelogram are (3x−2)∘and(x+48)∘.
Find the measure of each angle of the parallelogram.
View SolutionABC is a triangle . D is a point of AB such that AD=14ABandE is a point on AC such that AE=14AC. If DE=2cm find BC.
View SolutionState whether the statements are True or False.
(i) Every parallelogram is a trapezium ( )
View SolutionState which of the following are mathematical statements and which are not? Give reason.
She has blue rays
View SolutionSimplify the following expressions .
i) (5+√7)(2+√5)
ii) (5+√5)(5−√5)
iii) (√3+√7)2
iv) (√11−√7)(√11+√7)
View SolutionHow many lines of symmetry does the above figure have ?
View SolutionDetermine the point of symmetry of a regular hexagon.
View SolutionDtermine the images of the following figure about the given line :
View SolutionMatch the following Column A to Column B

View SolutionMatch the following Column A to Column B

View SolutionMatch the following Column A to Column B

View SolutionFind the area of the figure given below.

View SolutionThe area of the shaded part in the figure given below is ______.

View SolutionThe inequation represented by the graph given below is :
View SolutionThe inequation that best describes the graph given below is _________
View Solution