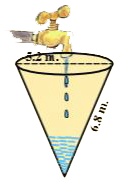
Water is pouring into a conical vessel of diameter 5.2m. And slant height 6.8 m(as shown in the adjoining ) , at the rate of 1.8 m3 per minute .How long will it take to fill the vessel?
 Solution in Telugu
Step by step video, text & image solution for Water is pouring into a conical vessel of diameter 5.2m. And slant height 6.8 m(as shown in the adjoining ) , at the rate of 1.8 m^(3) per minute .How long will it take to fill the vessel? by Maths experts to help you in doubts & scoring excellent marks in Class 9 exams.
Updated on:21/07/2023Topper's Solved these Questions
- SURFACE AREAS AND VOLUMES BOOK - NCERT TELUGUCHAPTER - SURFACE AREAS AND VOLUMES EXERCISE - EXERCISE 10.4
12 Videos
- SURFACE AREAS AND VOLUMES BOOK - NCERT TELUGUCHAPTER - SURFACE AREAS AND VOLUMES EXERCISE - EXERCISE - 10.1
9 Videos
- SURFACE AREAS AND VOLUMES BOOK - NCERT TELUGUCHAPTER - SURFACE AREAS AND VOLUMES EXERCISE - EXERCISE 10.2
11 Videos
- STATISTICSBOOK - NCERT TELUGUCHAPTER - STATISTICSEXERCISE - EXERCISE-9.2
11 Videos
- THE ELEMENTS OF GEOMETRY BOOK - NCERT TELUGUCHAPTER - THE ELEMENTS OF GEOMETRY EXERCISE - BRAIN TEASER
2 Videos
Similar Questions
The radius of sphere is 3.5cm Find its surface area and volume .
View SolutionFind the later surface area and total surface area of the following right prisms.

View SolutionA closed cylindrical tank of height 1.4 m. and radius of the base is 56 cm. is made up of a thick metal sheet. How much metal sheet is required (Express in square meters)
View SolutionWeights of parcels in a transport office are given below.

Find the mean weight of the parcels.
View SolutionIn the figure x = ………..

View SolutionHow many lines of symmetry does the above figure have ?
View SolutionDetermine the point of symmetry of a regular hexagon.
View SolutionMatch the following Column A to Column B

View SolutionMatch the following Column A to Column B

View SolutionMatch the following Column A to Column B

View SolutionThe inequation represented by the graph given below is :
View SolutionThe inequation that best describes the graph given below is _________
View SolutionThe inequation that best describes the following graph is _________
View SolutionThe equation of straight line shown in figure is :
ltimg src="https://d10lpgp6xz60nq.cloudfront.net/physics_images/ALN_PHY_R04_E01_020_Q01.png" width="80%"gt
View SolutionWhat is the distance OA for the square shown in figure :- ltimg src="https://d10lpgp6xz60nq.cloudfront.net/physics_images/ALN_PHY_R05_E01_015_Q01.png" width="80%"gt
View Solution
