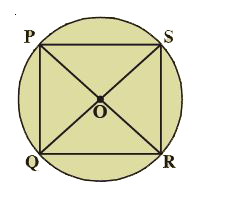
In the figure PR and QS are two diameters. Is PQ = RS?
 Solution in Telugu
The correct Answer is:Yes
Step by step video, text & image solution for In the figure PR and QS are two diameters. Is PQ = RS? by Maths experts to help you in doubts & scoring excellent marks in Class 9 exams.
Updated on:21/07/2023Topper's Solved these Questions
- CIRCLESBOOK - NCERT TELUGUCHAPTER - CIRCLESEXERCISE - EXERCISE 12.3
11 Videos
- CIRCLESBOOK - NCERT TELUGUCHAPTER - CIRCLESEXERCISE - EXERCISE 12.4
18 Videos
- CIRCLESBOOK - NCERT TELUGUCHAPTER - CIRCLESEXERCISE - EXERCISE 12.1
23 Videos
- AREAS BOOK - NCERT TELUGUCHAPTER - AREAS EXERCISE - EXERCISE 11.3
10 Videos
- CO-0RDINATE GEOMETRYBOOK - NCERT TELUGUCHAPTER - CO-0RDINATE GEOMETRYEXERCISE - EXERCISE
99 Videos
Similar Questions
Draw the following triangles and construct circumcircles for them.
In ΔABC,AB=6cm,BC=7cm and ∠A=60∘
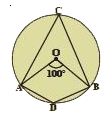
View SolutionIn the figure 'O' is the centre of the circle
∠AOB=100∘ find ∠ADB

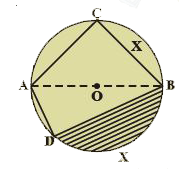
View SolutionName the following parts from the adjacent figure where ‘O’ is the centre of the circle

(i)¯¯¯¯¯¯AO(ii)¯¯¯¯¯¯AB(iii)⌢(BC)(iv)¯¯¯¯¯¯AC(v)⌢(DCB)(vi)⌢(ACB)(vi)¯¯¯¯¯¯AD (viii) shadedregion
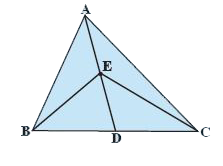
View SolutionIn a triangle ABC (see figure), E is the midpoint of median AD, show that
(i) ar ΔABE=arΔACE
(ii) arΔABE=14ar(ΔABC)

View SolutionThe set of intelligent students in a class is
View SolutionHow many lines of symmetry does the above figure have ?
View SolutionDetermine the point of symmetry of a regular hexagon.
View SolutionDtermine the images of the following figure about the given line :
View SolutionMatch the following Column A to Column B

View SolutionMatch the following Column A to Column B

View SolutionMatch the following Column A to Column B

View SolutionFind the area of the figure given below.

View SolutionThe area of the shaded part in the figure given below is ______.

View SolutionThe inequation represented by the graph given below is :
View SolutionThe inequation that best describes the graph given below is _________
View SolutionThe inequation that best describes the following graph is _________
View Solution
