If any straight line parallel to X -axis intersects the graph of the function at most at one point then the function is
Step by step video & image solution for If any straight line parallel to X -axis intersects the graph of the function at most at one point then the function is by Maths experts to help you in doubts & scoring excellent marks in Class 12 exams.
Similar Questions
Given the graphs of the two functions, y=f(x)&y=g(x). In theadjacent figure from point A on the graph of the function y fx)corresponding to the given value of the independent variable (say x),a straight line is drawn parallel to the X-axis to intersect the bisectorof the first and the third quadrants at point B. From the point B astraight line parallel to the Y-axis is drawn to intersect the graph ofthe function y=g(x) at C. Again a straight line is drawn from the point C parallel to the X-axis, to intersect the line NN' at D. If thestraight line NN' is parallel to Y-axis, then the co-ordinates of the point D are
View SolutionA horizontal line meets the graph of the function y=f(x) in two points is f one one?
View Solution
Knowledge Check
- Question 1 - Select One
_____ curve is a horizontal straight line parallel to X-axis in perfect competition.
AARBMRCbotha (a) and (b)Dneiter (a) nor (b) - Question 2 - Select One
The graph of the function y=f(x) is symmetrical about the line x=2, then :
Af(x+2)=f(x-2)Bf(2+x)=f(2-x)Cf(x)=f(-x)Dnone of these - Question 3 - Select One
Equation of the straight line parallel to x - axis and also 3 units below x - axis is :
Ax=−3By = 3Cy = - 3Dx = 3
Graph of function: Vertical line test
View SolutionIf the graph of the function y = f(x) is symmetrical about the line x = 2, then
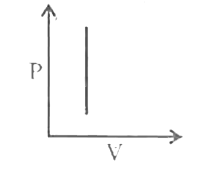
View SolutionThe graph of a thermodynamic process is a straight line parallel to pressure axis in P - V diagram. What is the work done in that process ?
 View Solution
A line is parallel to X-axis,if all the points on the line have equal………..
View SolutionThe angle between the tangent lines to the graph of the function f(x)=∫x2(2t−5)dt at the points where the graph cuts the x-axis is
View Solution
