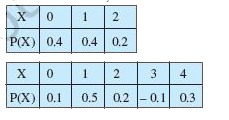
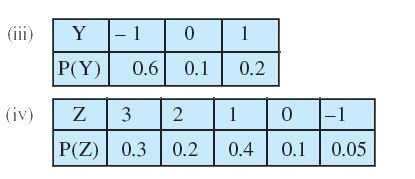
State which of the following are not the probability distributions of a random variable. Give reasons for your answer.

 Solution in Telugu
The correct Answer is:(ii), (iii) and (iv)
Step by step video, text & image solution for State which of the following are not the probability distributions of a random variable. Give reasons for your answer. by Maths experts to help you in doubts & scoring excellent marks in Class 12 exams.
Updated on:21/07/2023Topper's Solved these Questions
- PROBABILITYBOOK - NCERT TELUGUCHAPTER - PROBABILITYEXERCISE - EXERCISE 3.5
14 Videos
- PROBABILITYBOOK - NCERT TELUGUCHAPTER - PROBABILITYEXERCISE - MISCELLANEOUS EXERCISE ON CHAPTER 13
19 Videos
- PROBABILITYBOOK - NCERT TELUGUCHAPTER - PROBABILITYEXERCISE - EXERCISE 3.3
14 Videos
- MATRICESBOOK - NCERT TELUGUCHAPTER - MATRICESEXERCISE - Miscellaneous Exercise on Chapter 3
15 Videos
- RELATIONS AND FUNCTIONS BOOK - NCERT TELUGUCHAPTER - RELATIONS AND FUNCTIONS EXERCISE - MISCLELLANEOUS EXERCISE ON CHAPTER 1
18 Videos
Similar Questions
A die is thrown 6 times. If ‘getting an odd number' is a success, what is the probability of
(i) 5 successes? (ii) at least 5 successes?
(iii) at most 5 successes?
View SolutionA and B are two events such that P(A)≠0. Find P(B|A), if
(i) A is a subset of B (ii) A∩B=ϕ
View SolutionAn urn contains 5 red and 5 black balls. A ball is drawn at random, its colour is noted and is returned to the urn. Moreover, 2 additional balls of the colour drawn are put in the urn and then a ball is drawn at random. What is the probability that the second ball is red?
View SolutionLet A=[0100], show that (aI+bA)n=anI+nan−1bA, where I is the identity matrix of order 2 and n∈N.
View SolutionLet f:R→R be defined as f(x)=10x+7. Find the function g:R→R such that gof=f0g=IR.
View SolutionMatch the following lists:

View SolutionHow many lines of symmetry does the above figure have ?
View SolutionWhich of the following are correct chain isomers of butane ? (i)
View SolutionDetermine the point of symmetry of a regular hexagon.
View SolutionDtermine the images of the following figure about the given line :
View SolutionMatch the following Column A to Column B

View SolutionMatch the following Column A to Column B

View SolutionMatch the following Column A to Column B

View SolutionThe inequation represented by the graph given below is :
View SolutionThe inequation that best describes the graph given below is _________
View SolutionThe inequation that best describes the following graph is _________
View Solution