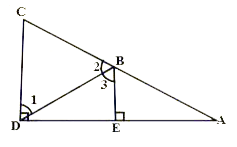
In the adjacent figure BE⊥ DA and CD⊥DA then prove that m∠1≅m∠3.
 Solution in Bengali
Step by step video & image solution for In the adjacent figure BE bot DA and CDbotDA then prove that mangle1 ~= m angle3. by Maths experts to help you in doubts & scoring excellent marks in Class 9 exams.
Updated on:21/07/2023Topper's Solved these Questions
- LINES AND ANGLES BOOK - NCERT BANGLISHCHAPTER - LINES AND ANGLES EXERCISE - DO THESE
8 Videos
- LINES AND ANGLES BOOK - NCERT BANGLISHCHAPTER - LINES AND ANGLES EXERCISE - TRY THIS
4 Videos
- LINES AND ANGLES BOOK - NCERT BANGLISHCHAPTER - LINES AND ANGLES EXERCISE - EXERCISE XERCISE - 4.3
19 Videos
- LINEAR EQUATIONS IN TWO VARIABLES BOOK - NCERT BANGLISHCHAPTER - LINEAR EQUATIONS IN TWO VARIABLES EXERCISE - EXERCISE 8.5
6 Videos
- POLYNOMIALS AND FACTORISATION BOOK - NCERT BANGLISHCHAPTER - POLYNOMIALS AND FACTORISATION EXERCISE - TRY THESE
6 Videos
Similar Questions
Observe your surroundings carefully and write any three situations of your daily life where you can observe lines and angles.
Draw the pictures in your note book and collect some pictures.
View SolutionConstruct the angle using ruler and compass and verify by measuring by a protractor.
60∘
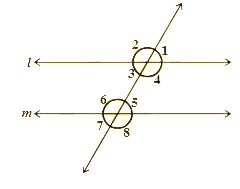
View SolutionIt is given that l || m to prove ∠1 is supplement to ∠8. Write reasons for the statement.
StatementReasonsi.l∣∣m.........ii.∠1=∠5............iii.∠1+∠4=180∘...........iv∠5+∠8=180∘............v.∠1is supplement to∠8.............

View Solution2x+3y=2 in this equation represent x as a function of y.
View SolutionWrite a polynomial with 2 terms in variable x.
View SolutionHow many lines of symmetry does the above figure have ?
View SolutionDetermine the point of symmetry of a regular hexagon.
View SolutionDtermine the images of the following figure about the given line :
View SolutionMatch the following Column A to Column B

View SolutionMatch the following Column A to Column B

View SolutionMatch the following Column A to Column B

View SolutionFind the area of the figure given below.

View SolutionThe area of the shaded part in the figure given below is ______.

View SolutionThe inequation represented by the graph given below is :
View SolutionThe inequation that best describes the graph given below is _________
View Solution
