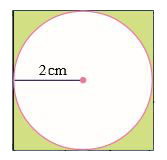
What is the probability that a randomly thrown dart hits the square board in shaded region
(Take π=227 and express in percentage)
 Solution in Bengali
Step by step video & image solution for What is the probability that a randomly thrown dart hits the square board in shaded region (Take π = (22)/(7) and express in percentage) by Maths experts to help you in doubts & scoring excellent marks in Class 9 exams.
Updated on:21/07/2023Topper's Solved these Questions
- PROBABILITY BOOK - NCERT BANGLISHCHAPTER - PROBABILITY EXERCISE - TRY THESE
7 Videos
- PROBABILITY BOOK - NCERT BANGLISHCHAPTER - PROBABILITY EXERCISE - THINK, DISCUSS AND WRITE
3 Videos
- PROBABILITY BOOK - NCERT BANGLISHCHAPTER - PROBABILITY EXERCISE - DO THIS
3 Videos
- POLYNOMIALS AND FACTORISATION BOOK - NCERT BANGLISHCHAPTER - POLYNOMIALS AND FACTORISATION EXERCISE - TRY THESE
6 Videos
- PROOFS IN MATHEMATICSBOOK - NCERT BANGLISHCHAPTER - PROOFS IN MATHEMATICSEXERCISE - EXERCISE - 15.4
15 Videos
Similar Questions
If you try to start a scooter , What are the possible outcomes?
View SolutionIn rolling a die .
Does the first player have a greater chance of getting a six on the top face?

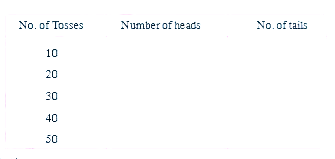
View SolutionToss a coin for number of times as shown in the table. And record your findings in the table.

What happens if you keep on increasing the number of tosses.
View SolutionWrite a polynomial with 2 terms in variable x.
View SolutionState which of the following are mathematical statements and which are not? Give reason.
She has blue rays
View SolutionDetermine the point of symmetry of a regular hexagon.
View SolutionMatch the following Column A to Column B

View SolutionMatch the following Column A to Column B

View SolutionMatch the following Column A to Column B

View SolutionThe area of the shaded part in the figure given below is ______.

View SolutionThe inequation represented by the graph given below is :
View SolutionThe inequation that best describes the graph given below is _________
View SolutionThe inequation that best describes the following graph is _________
View SolutionWhich inequations represent the shaded region in the given figure
View SolutionWhat is the distance OA for the square shown in figure :- ltimg src="https://d10lpgp6xz60nq.cloudfront.net/physics_images/ALN_PHY_R05_E01_015_Q01.png" width="80%"gt
View Solution
