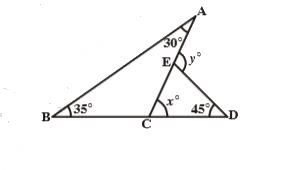
Using information given in the adjacent figure, find the value of x and y.
 Solution in Kannada
Step by step video & image solution for Using information given in the adjacent figure, find the value of x and y. by Maths experts to help you in doubts & scoring excellent marks in Class 9 exams.
Updated on:21/07/2023Topper's Solved these Questions
- LINES AND ANGLES BOOK - NCERT KANNADCHAPTER - LINES AND ANGLES EXERCISE - EXERCISE XERCISE - 4.1
11 Videos
- LINES AND ANGLES BOOK - NCERT KANNADCHAPTER - LINES AND ANGLES EXERCISE - EXERCISE XERCISE - 4.2
8 Videos
- LINEAR EQUATIONS IN TWO VARIABLES BOOK - NCERT KANNADCHAPTER - LINEAR EQUATIONS IN TWO VARIABLES EXERCISE - EXERCISE 8.5
6 Videos
- POLYNOMIALS AND FACTORISATION BOOK - NCERT KANNADCHAPTER - POLYNOMIALS AND FACTORISATION EXERCISE - TRY THESE
5 Videos
Similar Questions
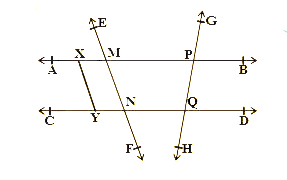
In the given figure, name

(i) any six points
(ii) any five line segments
(iii) any four rays
(iv) any four lines
(v) any four collinear points
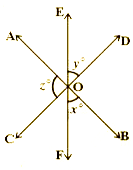
View SolutionIn the given figure three lines ¯¯¯¯¯¯AB,¯¯¯¯¯¯CD and ¯¯¯¯¯¯EF intersecting at O. Find the values of x, y and z it is being given that x : y : z = 2 : 3 : 5

View SolutionGive the graphical representation of the following equation.
(a) On the number line and (b)On the Cartesian plane
(i) x = 3 (ii) y + 3 = 0 (iii) y = 4 (iv) 2x – 9 = 0
(v) 3x + 5 = 0
View SolutionWrite a polynomial with 2 terms in variable x.
View SolutionHow many lines of symmetry does the above figure have ?
View SolutionDetermine the point of symmetry of a regular hexagon.
View SolutionDtermine the images of the following figure about the given line :
View SolutionMatch the following Column A to Column B

View SolutionMatch the following Column A to Column B

View SolutionMatch the following Column A to Column B

View SolutionFind the area of figure given below.

View SolutionFind the perimeter of the figure given below.

View SolutionFind the area of the figure given below.

View SolutionThe area of the shaded part in the figure given below is ______.

View SolutionThe inequation represented by the graph given below is :
View SolutionThe inequation that best describes the graph given below is _________
View Solution
