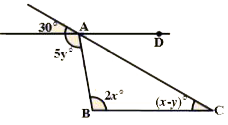
Find the values of x, y for which the lines AD and BC become parallel.
 Solution in Kannada
Step by step video & image solution for Find the values of x, y for which the lines AD and BC become parallel. <BR> by Maths experts to help you in doubts & scoring excellent marks in Class 9 exams.
Updated on:21/07/2023Topper's Solved these Questions
- LINES AND ANGLES BOOK - NCERT KANNADCHAPTER - LINES AND ANGLES EXERCISE - DO THESE
6 Videos
- LINES AND ANGLES BOOK - NCERT KANNADCHAPTER - LINES AND ANGLES EXERCISE - TRY THIS
3 Videos
- LINES AND ANGLES BOOK - NCERT KANNADCHAPTER - LINES AND ANGLES EXERCISE - EXERCISE XERCISE - 4.3
18 Videos
- LINEAR EQUATIONS IN TWO VARIABLES BOOK - NCERT KANNADCHAPTER - LINEAR EQUATIONS IN TWO VARIABLES EXERCISE - EXERCISE 8.5
6 Videos
- POLYNOMIALS AND FACTORISATION BOOK - NCERT KANNADCHAPTER - POLYNOMIALS AND FACTORISATION EXERCISE - TRY THESE
5 Videos
Similar Questions
Write the complementary, supplementary and conjugate angles for the following angles.
(a)45∘(b)75∘(c)54∘(d)30∘
(e)60∘(f)90∘(g)0∘
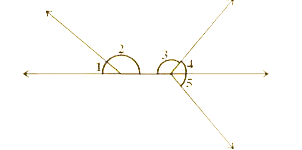
View SolutionList the adjacent angles in the given figure.

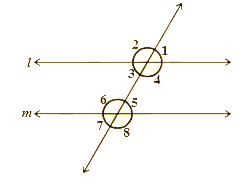
View SolutionIt is given that l || m to prove ∠1 is supplement to ∠8. Write reasons for the statement.
StatementReasonsi.l∣∣m.........ii.∠1=∠5............iii.∠5+∠8=180∘...........iv∠5+∠8=180∘............v.∠1is supplement to∠8.............

View SolutionGive the graphical representation of the following equation.
(a) On the number line and (b)On the Cartesian plane
(i) x = 3 (ii) y + 3 = 0 (iii) y = 4 (iv) 2x – 9 = 0
(v) 3x + 5 = 0
View SolutionWrite a polynomial with 2 terms in variable x.
View SolutionHow many lines of symmetry does the above figure have ?
View SolutionWhich of the following are correct chain isomers of butane ? (i)
View SolutionDetermine the point of symmetry of a regular hexagon.
View SolutionDtermine the images of the following figure about the given line :
View SolutionMatch the following Column A to Column B

View SolutionMatch the following Column A to Column B

View SolutionMatch the following Column A to Column B

View SolutionThe inequation represented by the graph given below is :
View SolutionThe inequation that best describes the graph given below is _________
View SolutionThe inequation that best describes the following graph is _________
View SolutionWhich inequations represent the shaded region in the given figure
View Solution
