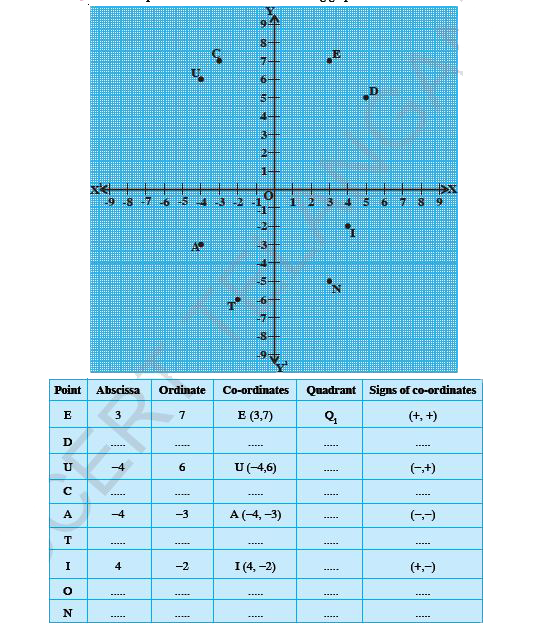
Complete the table based on the following graph.  Solution in Kannada
Step by step video & image solution for Complete the table based on the following graph. by Maths experts to help you in doubts & scoring excellent marks in Class 9 exams.
Updated on:21/07/2023Topper's Solved these Questions
- CO-ORDINATE GEOMETRYBOOK - NCERT KANNADCHAPTER - CO-ORDINATE GEOMETRYEXERCISE - Exercise 5.2
11 Videos
- CO-ORDINATE GEOMETRYBOOK - NCERT KANNADCHAPTER - CO-ORDINATE GEOMETRYEXERCISE - Exercise 5.3
10 Videos
- CIRCLESBOOK - NCERT KANNADCHAPTER - CIRCLESEXERCISE - EXERCISE 12.5
3 Videos
- GEOMETRICAL CONSTRUCTIONSBOOK - NCERT KANNADCHAPTER - GEOMETRICAL CONSTRUCTIONSEXERCISE - TRY THIS
3 Videos
Similar Questions
Which the quadrant in which following points lie?
(i) (-2,3) (ii) (5,-3) (iii) (4,2) (iv) (-7,-6)
(v) (0,8) (vi) (3,0) (vii) (-4,0) (viii) (0,-6)
View SolutionPlot the following in the Cartisian plane whose x,y co-ordinates are given

View SolutionGiven that the vertices A, B, C of a quadrilateral ABCD lie on a circle. Also ∠A+∠C=180∘ , then prove that the vertex D also lie on the same circle.
View SolutionDraw a circle, Identify a point on it. Cut arcs on the circle with the length of the radius in succession. How many parts can the circle be divided into? Give reason.
View SolutionMatch the following lists:

View SolutionHow many lines of symmetry does the above figure have ?
View SolutionWhich of the following are correct chain isomers of butane ? (i)
View SolutionDetermine the point of symmetry of a regular hexagon.
View SolutionDtermine the images of the following figure about the given line :
View SolutionMatch the following Column A to Column B

View SolutionMatch the following Column A to Column B

View SolutionMatch the following Column A to Column B

View SolutionThe inequation represented by the graph given below is :
View SolutionThe inequation that best describes the graph given below is _________
View SolutionThe inequation that best describes the following graph is _________
View SolutionWhich inequations represent the shaded region in the given figure
View Solution