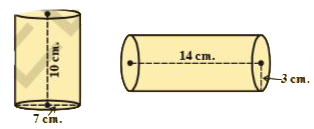
Find CSA of each of following cylinders
(i) r=xcm,h=ycm
(ii) d=7cm,h=10cm
(iii) r=3,h=14cm
 Solution in Kannada
Step by step video & image solution for Find CSA of each of following cylinders (i) r=x cm , h= y cm (ii) d= 7cm , h= 10 cm (iii) r= 3, h= 14cm by Maths experts to help you in doubts & scoring excellent marks in Class 9 exams.
Updated on:21/07/2023Topper's Solved these Questions
- SURFACE AREAS AND VOLUMES BOOK - NCERT KANNADCHAPTER - SURFACE AREAS AND VOLUMES EXERCISE - TRY THIS
4 Videos
- SURFACE AREAS AND VOLUMES BOOK - NCERT KANNADCHAPTER - SURFACE AREAS AND VOLUMES EXERCISE - EXERCISE 10.1
7 Videos
- SURFACE AREAS AND VOLUMES BOOK - NCERT KANNADCHAPTER - SURFACE AREAS AND VOLUMES EXERCISE - EXERCISE 10.4
12 Videos
- STATISTICSBOOK - NCERT KANNADCHAPTER - STATISTICSEXERCISE - Do THIS
1 Videos
- THE ELEMENTS OF GEOMETRY BOOK - NCERT KANNADCHAPTER - THE ELEMENTS OF GEOMETRY EXERCISE - BRAIN TEASER
2 Videos
Similar Questions
Find the edge of a cube whose volume is 1000cm3
View SolutionThe total surface area of a cube is 1350 sq.m Find its volume.
View SolutionThe radius of sphere is 3.5cm Find its surface area and volume .
View SolutionWhich of the following are primary and secondary data?
i. Collection of the data about enrollment of students in your school for a period from 2001 to 2010.
ii. Height of students in your class recorded by physical education teacher.
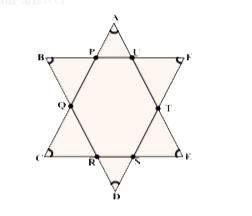
View SolutionWhat is the measure of ∠A+∠B+∠C+∠D+∠E+∠F in the figure given below. Give reason to your answer.

View SolutionWhich of the following are correct chain isomers of butane ? (i)
View SolutionDetermine the point of symmetry of a regular hexagon.
View SolutionIn the following figures, PT=4 cm , TQ=6cm and RT=3 cm , then TS=_______________.
View SolutionFind the area of the shaded region, given that the radius of each circle is equal to 5 cm.
View SolutionMatch the following Column A to Column B

View SolutionMatch the following Column A to Column B

View SolutionMatch the following Column A to Column B

View SolutionThe inequation represented by the graph given below is :
View SolutionThe inequation that best describes the graph given below is _________
View SolutionThe inequation that best describes the following graph is _________
View Solution
