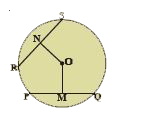
In the figure, ‘O’ is the centre of the circle and OM, ON are the perpendiculars from the centre to the chords PQ and RS. If OM = ON and PQ = 6cm. Find RS
 Solution in Kannada
The correct Answer is:6 cm
Step by step video & image solution for In the figure, ‘O’ is the centre of the circle and OM, ON are the perpendiculars from the centre to the chords PQ and RS. If OM = ON and PQ = 6cm. Find RS by Maths experts to help you in doubts & scoring excellent marks in Class 9 exams.
Updated on:21/07/2023Topper's Solved these Questions
- CIRCLESBOOK - NCERT KANNADCHAPTER - CIRCLESEXERCISE - EXERCISE 12.5
3 Videos
- CIRCLESBOOK - NCERT KANNADCHAPTER - CIRCLESEXERCISE - EXERCISE 12.3
3 Videos
- AREAS BOOK - NCERT KANNADCHAPTER - AREAS EXERCISE - EXERCISE 11.3
4 Videos
- CO-ORDINATE GEOMETRYBOOK - NCERT KANNADCHAPTER - CO-ORDINATE GEOMETRYEXERCISE - Try These
2 Videos
Similar Questions
Given that the vertices A, B, C of a quadrilateral ABCD lie on a circle. Also ∠A+∠C=180∘ , then prove that the vertex D also lie on the same circle.
View SolutionDraw two circles passing through A, B where AB = 5.4cm
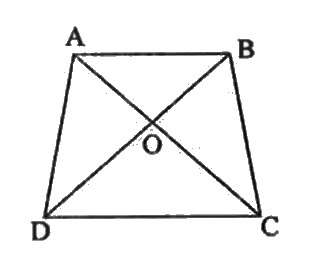
View SolutionDiagonals AC and BD of a trapezium ABCD with AB∣∣DC intersect each other at O. Prove that ar (AOD) = ar (BOC).

View SolutionWhich axis the points such as (0,x) (0,y) (0,2) and (0,-5) lie on? Why?
View SolutionIn the given figure (not to scale), O is the centre of the circle. A,B,C and D are concyclic and AB=CD . If /_MON =120^(@) , then find /_ OPN .
View SolutionDetermine the point of symmetry of a regular hexagon.
View SolutionDtermine the images of the following figure about the given line :
View SolutionIn the given figure, AB is a diameter, O is the center of the circle and ∠OCB=50∘ then find ∠DBC.
View SolutionMatch the following Column A to Column B

View SolutionMatch the following Column A to Column B

View SolutionMatch the following Column A to Column B

View SolutionFind the area of figure given below.

View SolutionFind the perimeter of the figure given below.

View SolutionFind the area of the figure given below.

View SolutionThe inequation represented by the graph given below is :
View SolutionThe inequation that best describes the graph given below is _________
View Solution