Envied by the popularity of Pythagoras his disciple claimed a different relation between the sides of right angle triangles. By observing this what do you notice?
 Solution in Kannada
Step by step video & image solution for Envied by the popularity of Pythagoras his disciple claimed a different relation between the sides of right angle triangles. By observing this what do you notice? by Maths experts to help you in doubts & scoring excellent marks in Class 9 exams.
Updated on:21/07/2023Topper's Solved these Questions
- PROOFS IN MATHEMATICSBOOK - NCERT KANNADCHAPTER - PROOFS IN MATHEMATICSEXERCISE - DO THIS
1 Video
- PROOFS IN MATHEMATICSBOOK - NCERT KANNADCHAPTER - PROOFS IN MATHEMATICSEXERCISE - EXERCISE - 15.1
16 Videos
- PROOFS IN MATHEMATICSBOOK - NCERT KANNADCHAPTER - PROOFS IN MATHEMATICSEXERCISE - EXERCISE - 15.4
15 Videos
- PROBABILITY BOOK - NCERT KANNADCHAPTER - PROBABILITY EXERCISE - DO THIS
3 Videos
- QUADRILATERALSBOOK - NCERT KANNADCHAPTER - QUADRILATERALSEXERCISE - EXERCISE - 8.4
6 Videos
Similar Questions
Make 5 more sentences and check whether they are statements or not. Give reasons
View SolutionState whether the following sentences are always true, always false or ambiguous. Justify your answer
There are 27 days in a month.
View SolutionState which of the following are mathematical statements and which are not? Give reason.
She has blue rays
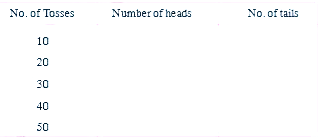
View SolutionToss a coin for number of times as shown in the table. And record your findings in the table.

What happens if you keep on increasing the number of tosses.
View SolutionABC is a triangle . D is a point of AB such that AD=14ABandE is a point on AC such that AE=14AC. If DE=2cm find BC.
View SolutionWhich of the following are correct chain isomers of butane ? (i)
View SolutionDetermine the point of symmetry of a regular hexagon.
View SolutionDtermine the images of the following figure about the given line :
View SolutionMatch the following Column A to Column B

View SolutionMatch the following Column A to Column B

View SolutionMatch the following Column A to Column B

View SolutionThe inequation represented by the graph given below is :
View SolutionThe inequation that best describes the graph given below is _________
View SolutionThe inequation that best describes the following graph is _________
View SolutionWhich inequations represent the shaded region in the given figure
View Solution