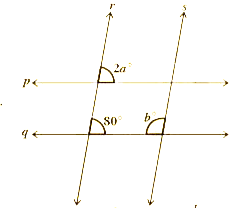
Find the value of a and b, given that p || q and r || s.
 Solution in Tamil
The correct Answer is:AB = BC = CD = DA = 3√2 AC = BD = 6 (vertices of a square)
Step by step video & image solution for Find the value of a and b, given that p || q and r || s. by Maths experts to help you in doubts & scoring excellent marks in Class 10 exams.
Updated on:21/07/2023Topper's Solved these Questions
- COORDINATE GEOMETRY BOOK - NCERT TAMILCHAPTER - COORDINATE GEOMETRY EXERCISE - EXERCISE 7.2
12 Videos
- COORDINATE GEOMETRY BOOK - NCERT TAMILCHAPTER - COORDINATE GEOMETRY EXERCISE - EXERCISE 7.3
9 Videos
- COORDINATE GEOMETRY BOOK - NCERT TAMILCHAPTER - COORDINATE GEOMETRY EXERCISE - TRY THIS
15 Videos
- APPLICATIONS OF TRIGONOMETRYBOOK - NCERT TAMILCHAPTER - APPLICATIONS OF TRIGONOMETRYEXERCISE - THINK AND DISCUSS
1 Videos
- GEOMETRYBOOK - NCERT TAMILCHAPTER - GEOMETRYEXERCISE - UNIT EXERCISE - 4
5 Videos
Similar Questions
Find the coordinates of the point which divides the line segment joining the points (-1, 7) and (4, -3) in the ratio 2:3 .
View SolutionFind the area of the triangle vertices are
(2, 3) (-1, 0), (2, -4)
View SolutionWhere do these following points lie (0, -3), (0, -8), (0, 6) and (0, 4) on coordinate plane?
View SolutionYou are observing top of your school building at an angle of elevation a from a point which is at d meter distance from foot of the building
Which trigonometric ratio would you like to consider to find the height of the building?
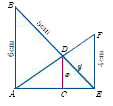
View SolutionIn the given figure AB||CD||EF.
If AB = 6 cm, CD = x cm, EF = 4 cm, BD = 5 cm and DE = y cm. Find x and y.

View SolutionDetermine the point of symmetry of a regular hexagon.
View SolutionDtermine the images of the following figure about the given line :
View SolutionMatch the following Column A to Column B

View SolutionMatch the following Column A to Column B

View SolutionMatch the following Column A to Column B

View SolutionFind the area of figure given below.

View SolutionFind the perimeter of the figure given below.

View SolutionFind the area of the figure given below.

View SolutionThe inequation represented by the graph given below is :
View SolutionThe inequation that best describes the graph given below is _________
View SolutionThe inequation that best describes the following graph is _________
View Solution
