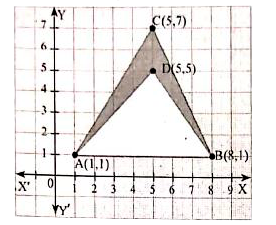
Find the area of the shaded region.
 Solution in Tamil
Step by step video & image solution for Find the area of the shaded region. by Maths experts to help you in doubts & scoring excellent marks in Class 10 exams.
Updated on:21/07/2023Topper's Solved these Questions
- TANGENTS AND SECANTS TO A CIRCLEBOOK - NCERT TAMILCHAPTER - TANGENTS AND SECANTS TO A CIRCLEEXERCISE - What we have discussed
5 Videos
- TANGENTS AND SECANTS TO A CIRCLEBOOK - NCERT TAMILCHAPTER - TANGENTS AND SECANTS TO A CIRCLEEXERCISE - Do this
7 Videos
- TANGENTS AND SECANTS TO A CIRCLEBOOK - NCERT TAMILCHAPTER - TANGENTS AND SECANTS TO A CIRCLEEXERCISE - Exercise (9.3)
8 Videos
- STATISTICS AND PROBABILITY BOOK - NCERT TAMILCHAPTER - STATISTICS AND PROBABILITY EXERCISE - UNIT EXERCISE
12 Videos
- TRIGONOMETRY BOOK - NCERT TAMILCHAPTER - TRIGONOMETRY EXERCISE - OPTIONAL EXERCISE
6 Videos
Similar Questions
A Tangent to a circle is a line which touches the circle at only one point.
View SolutionDraw a circle with any radius and then draw two chords equidistant from the centre
View SolutionIn a circle of radius 10cm , a chord subtends a right angle at the centre. Find the area of the corresponding : (useπ=3.14)
i. Minor segment
ii. Major segment
View SolutionThe mean of the following frequency distribution is 62.8 and the sum of all frequencies is 50. Compute the missing frequencies f1andf2.

View SolutionProve that cotθ−cosθcotθ+cosθ=cosecθ−1cosecθ+1
View SolutionDetermine the point of symmetry of a regular hexagon.
View SolutionFind the area of the shaded region, given that the radius of each circle is equal to 5 cm.
View SolutionMatch the following Column A to Column B

View SolutionMatch the following Column A to Column B

View SolutionMatch the following Column A to Column B

View SolutionFind the area of figure given below.

View SolutionFind the area of the figure given below.

View SolutionThe area of the shaded part in the figure given below is ______.

View Solution
Find the area of the shaded part in the figure given above.
View SolutionThe inequation represented by the graph given below is :
View SolutionThe inequation that best describes the graph given below is _________
View Solution
