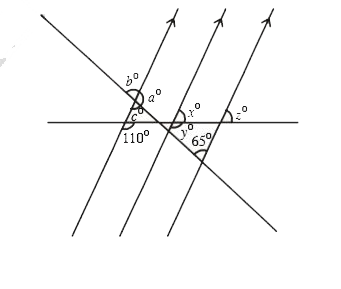
In the adjacent figure, find the value of x, y, z and a, b, c.
 Solution in Tamil
Step by step video & image solution for In the adjacent figure, find the value of x, y, z and a, b, c. by Maths experts to help you in doubts & scoring excellent marks in Class 10 exams.
Updated on:21/07/2023Topper's Solved these Questions
- TANGENTS AND SECANTS TO A CIRCLEBOOK - NCERT TAMILCHAPTER - TANGENTS AND SECANTS TO A CIRCLEEXERCISE - Try this
5 Videos
- TANGENTS AND SECANTS TO A CIRCLEBOOK - NCERT TAMILCHAPTER - TANGENTS AND SECANTS TO A CIRCLEEXERCISE - What we have discussed
5 Videos
- STATISTICS AND PROBABILITY BOOK - NCERT TAMILCHAPTER - STATISTICS AND PROBABILITY EXERCISE - UNIT EXERCISE
12 Videos
- TRIGONOMETRY BOOK - NCERT TAMILCHAPTER - TRIGONOMETRY EXERCISE - OPTIONAL EXERCISE
6 Videos
Similar Questions
How can you prove the converse of the above theorem.
" If a line in the plane of a circle is perpendicular to the radius at its endpoint on the circle, then the line is tangent of the circle ".
View SolutionA Tangent to a circle is a line which touches the circle at only one point.
View SolutionThe mean of the following frequency distribution is 62.8 and the sum of all frequencies is 50. Compute the missing frequencies f1andf2.

View SolutionProve that cotθ−cosθcotθ+cosθ=cosecθ−1cosecθ+1
View SolutionHow many lines of symmetry does the above figure have ?
View SolutionDetermine the point of symmetry of a regular hexagon.
View SolutionDtermine the images of the following figure about the given line :
View SolutionMatch the following Column A to Column B

View SolutionMatch the following Column A to Column B

View SolutionMatch the following Column A to Column B

View SolutionFind the area of figure given below.

View SolutionFind the perimeter of the figure given below.

View SolutionFind the area of the figure given below.

View SolutionThe area of the shaded part in the figure given below is ______.

View SolutionThe inequation represented by the graph given below is :
View SolutionThe inequation that best describes the graph given below is _________
View Solution
