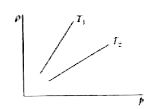
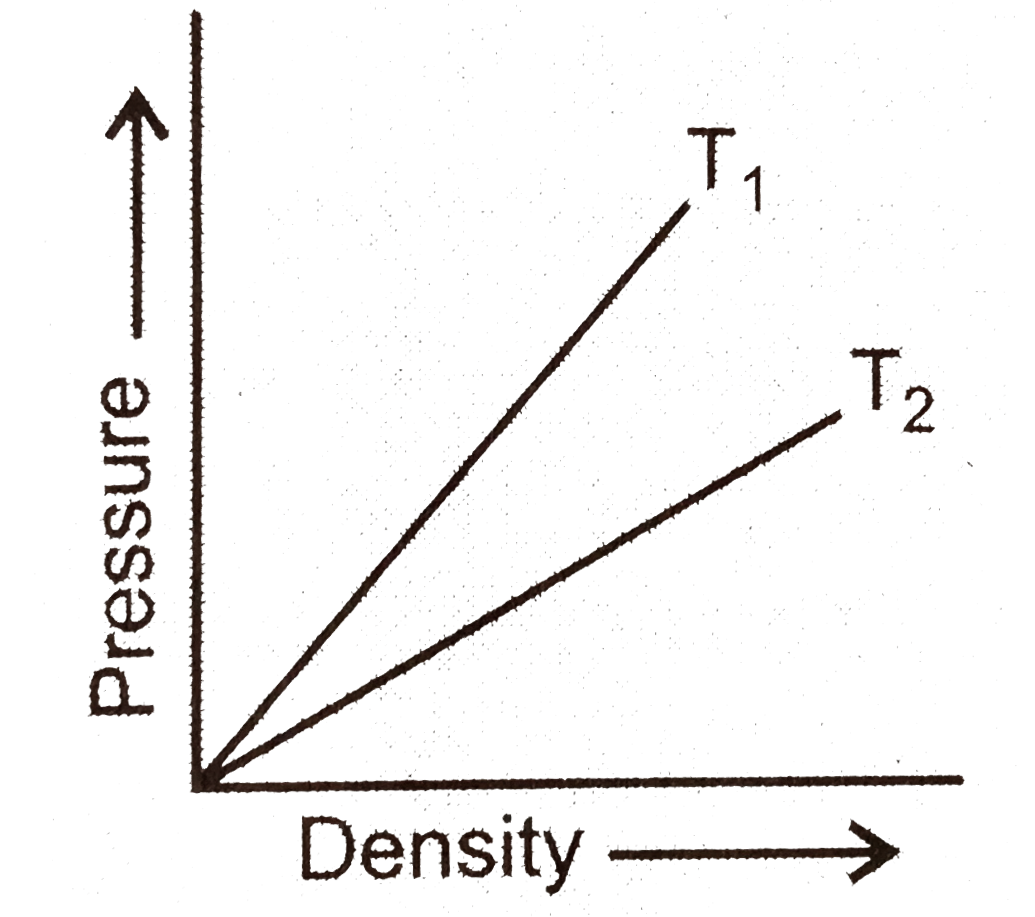
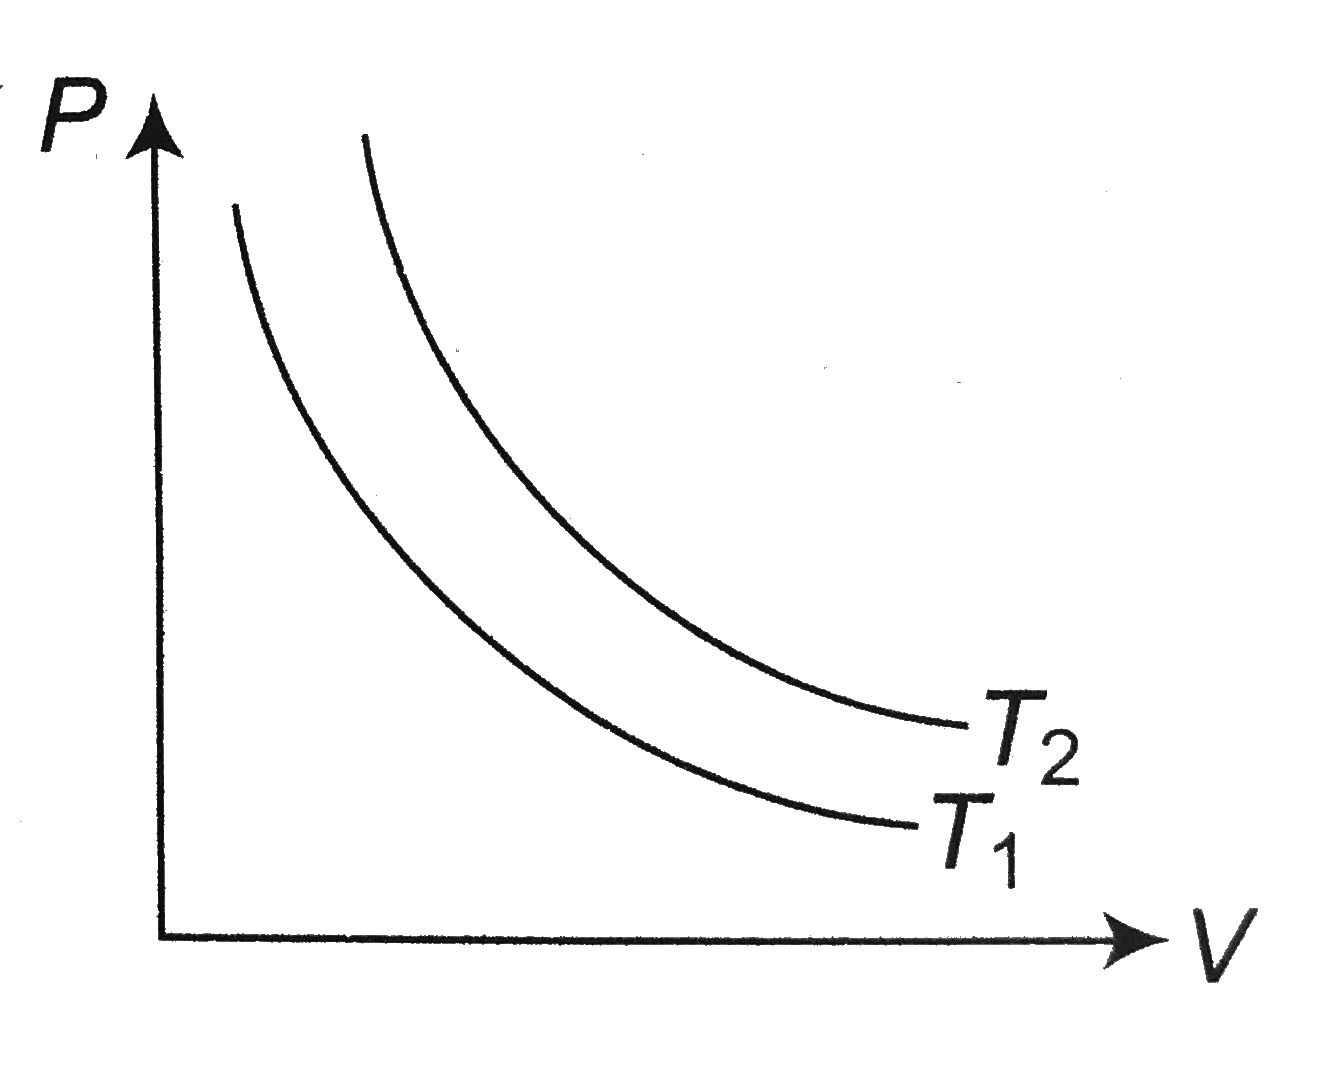
Figure shows graphs of pressure vs density for an ideal gas at two temperature T1 and T2 . Which of the following is correct ?
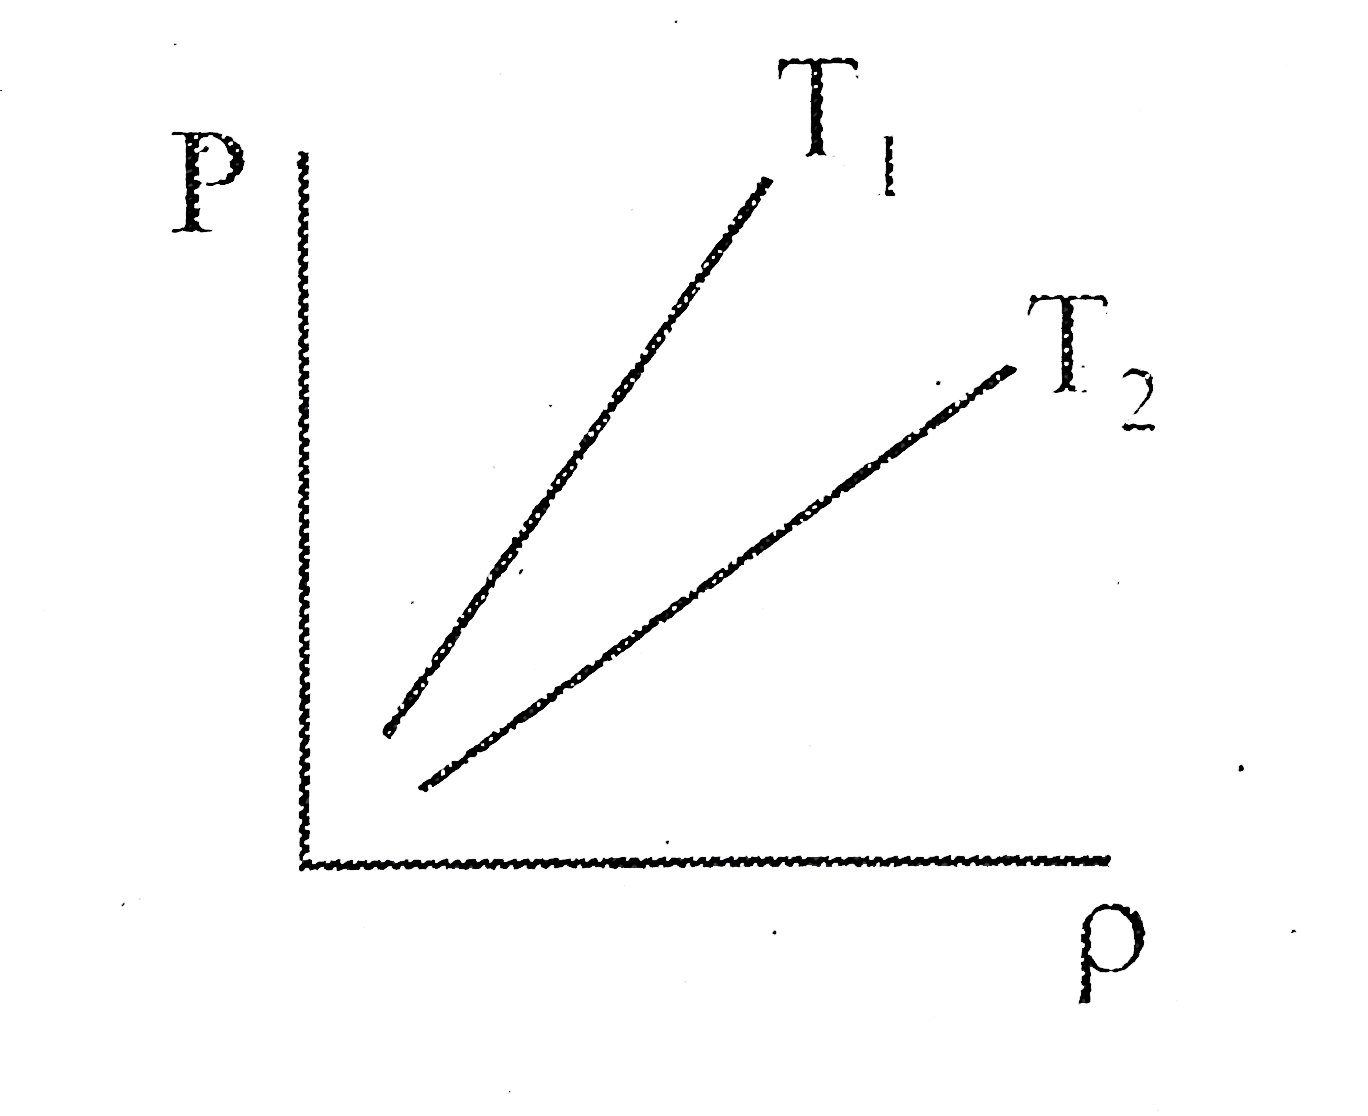
T1>T2
T1<T2
T1=T2
Cannot be said
The correct Answer is:A
N/a
Topper's Solved these Questions
- BOOK - ERRORLESS CHAPTER - GASEOUS STATE EXERCISE - ORDINARY THINKING (Objective Questions) Kinetic theory of gases and Molecular collisions28videos
GASEOUS STATE
- BOOK - ERRORLESS CHAPTER - GASEOUS STATE EXERCISE - ORDINARY THINKING (Objective Questions) Molecular speeds24videos
GASEOUS STATE
- BOOK - ERRORLESS CHAPTER - GASEOUS STATE EXERCISE - JEE SECTION JEE (Advanced) 2018 Numeric answer type question1videos
GASEOUS STATE
- BOOK - ERRORLESS CHAPTER - ENVIRONMENTAL CHEMISTRYEXERCISE - CRITICAL THINKING (Objective question )16videos
ENVIRONMENTAL CHEMISTRY
- BOOK - ERRORLESS CHAPTER - GENERAL ORGANIC CHEMISTRYEXERCISE - Matrix Match type questions4videos
GENERAL ORGANIC CHEMISTRY
Similar Questions
Knowledge Check
- Question 1 - Select One
Figure shows graphs of pressure vs density for an ideal gas at two temperatures Tt and T2
AT1>T2BT1=T2CT1<T2Dany of the three is possible - Question 2 - Select One
Shows graphs of pressure vs density for an ideal gas at two temperaturesT1andT2
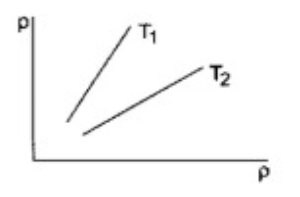 A(a)T1>T2B(b)T1=T2C(c)T1<T2D(d)Any of the three is possibe.
 - Question 3 - Select One
Figure shows graphs of pressure versus density for an ideal gas at two temperatures T1 and T2 Which is correct ?
 .AT1>T2BT2>T1CBothDNone of these
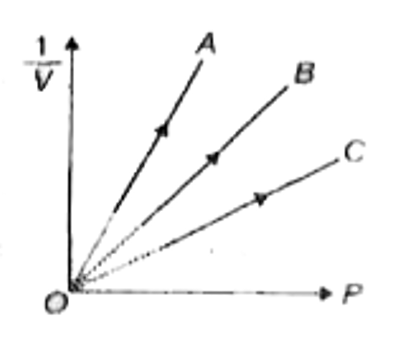
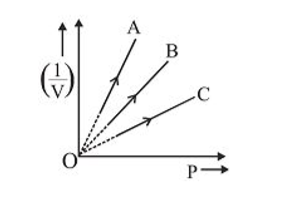
Figure shows the isotherms of fixed mass of an ideal gas at three temperatures TA.TB and TC then:-
 View Solution
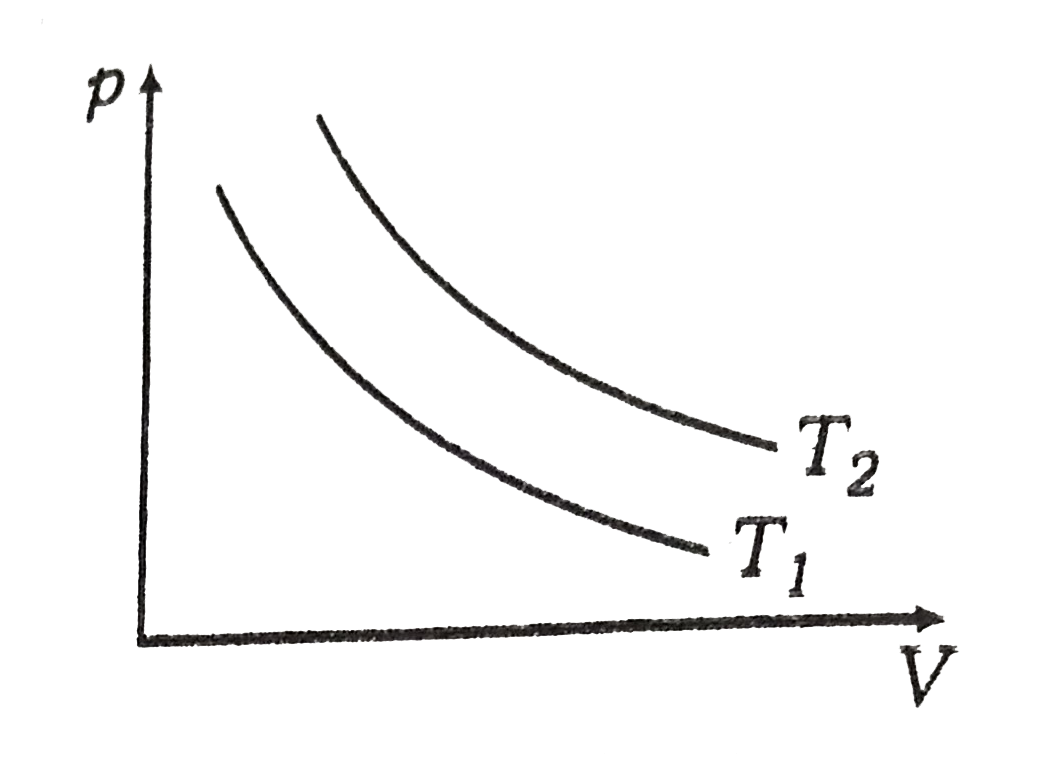
The adjoining fgure shows graph of pressure and volume of a gas at two temperatures T1 and T2 Which one the following is correct
 View Solution
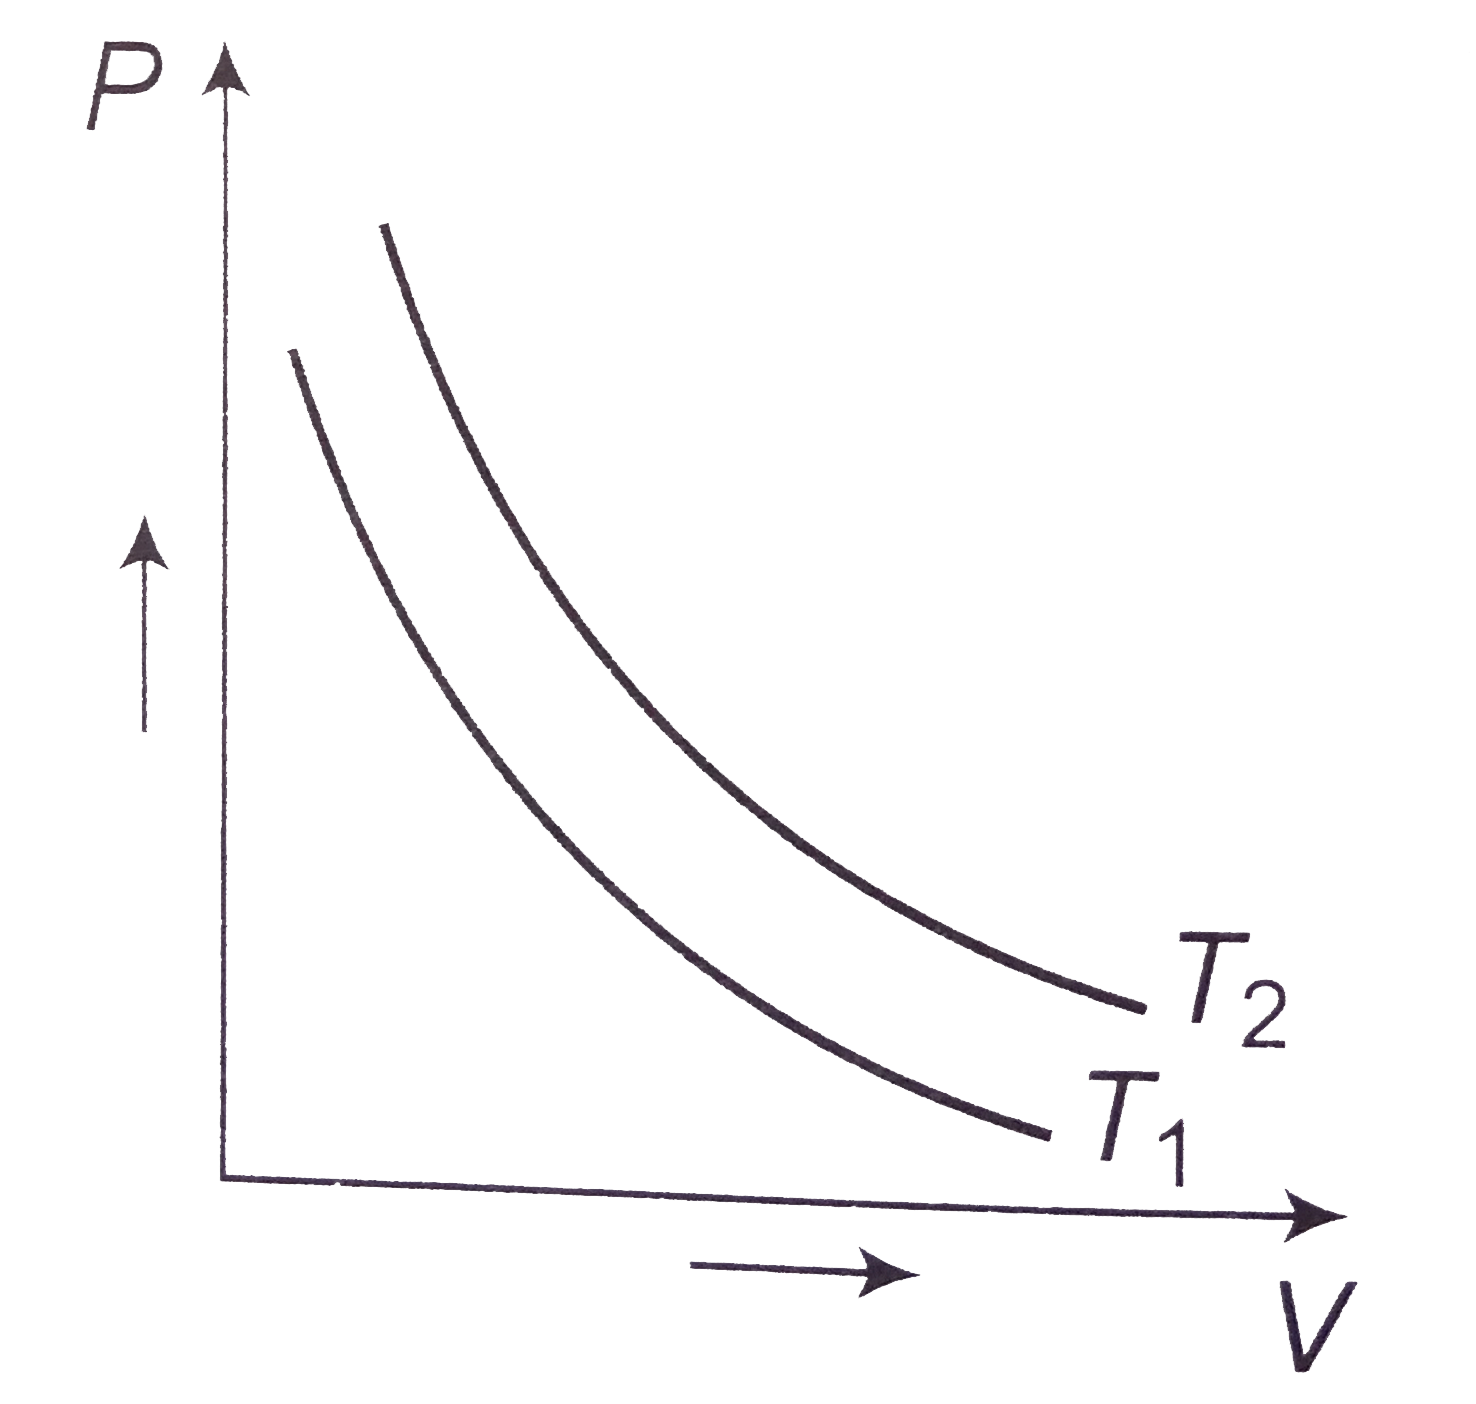
The adjoining figure shows graphs of pressure and volume of a gas at two temperature T1 and T2 Which of the following inferences is correct?View SolutionFigure shows the pressure P versus volume V graphs for a certains mass of a gas at two constant temperature T1andT2. Which of the following interface is correct?
 View Solution
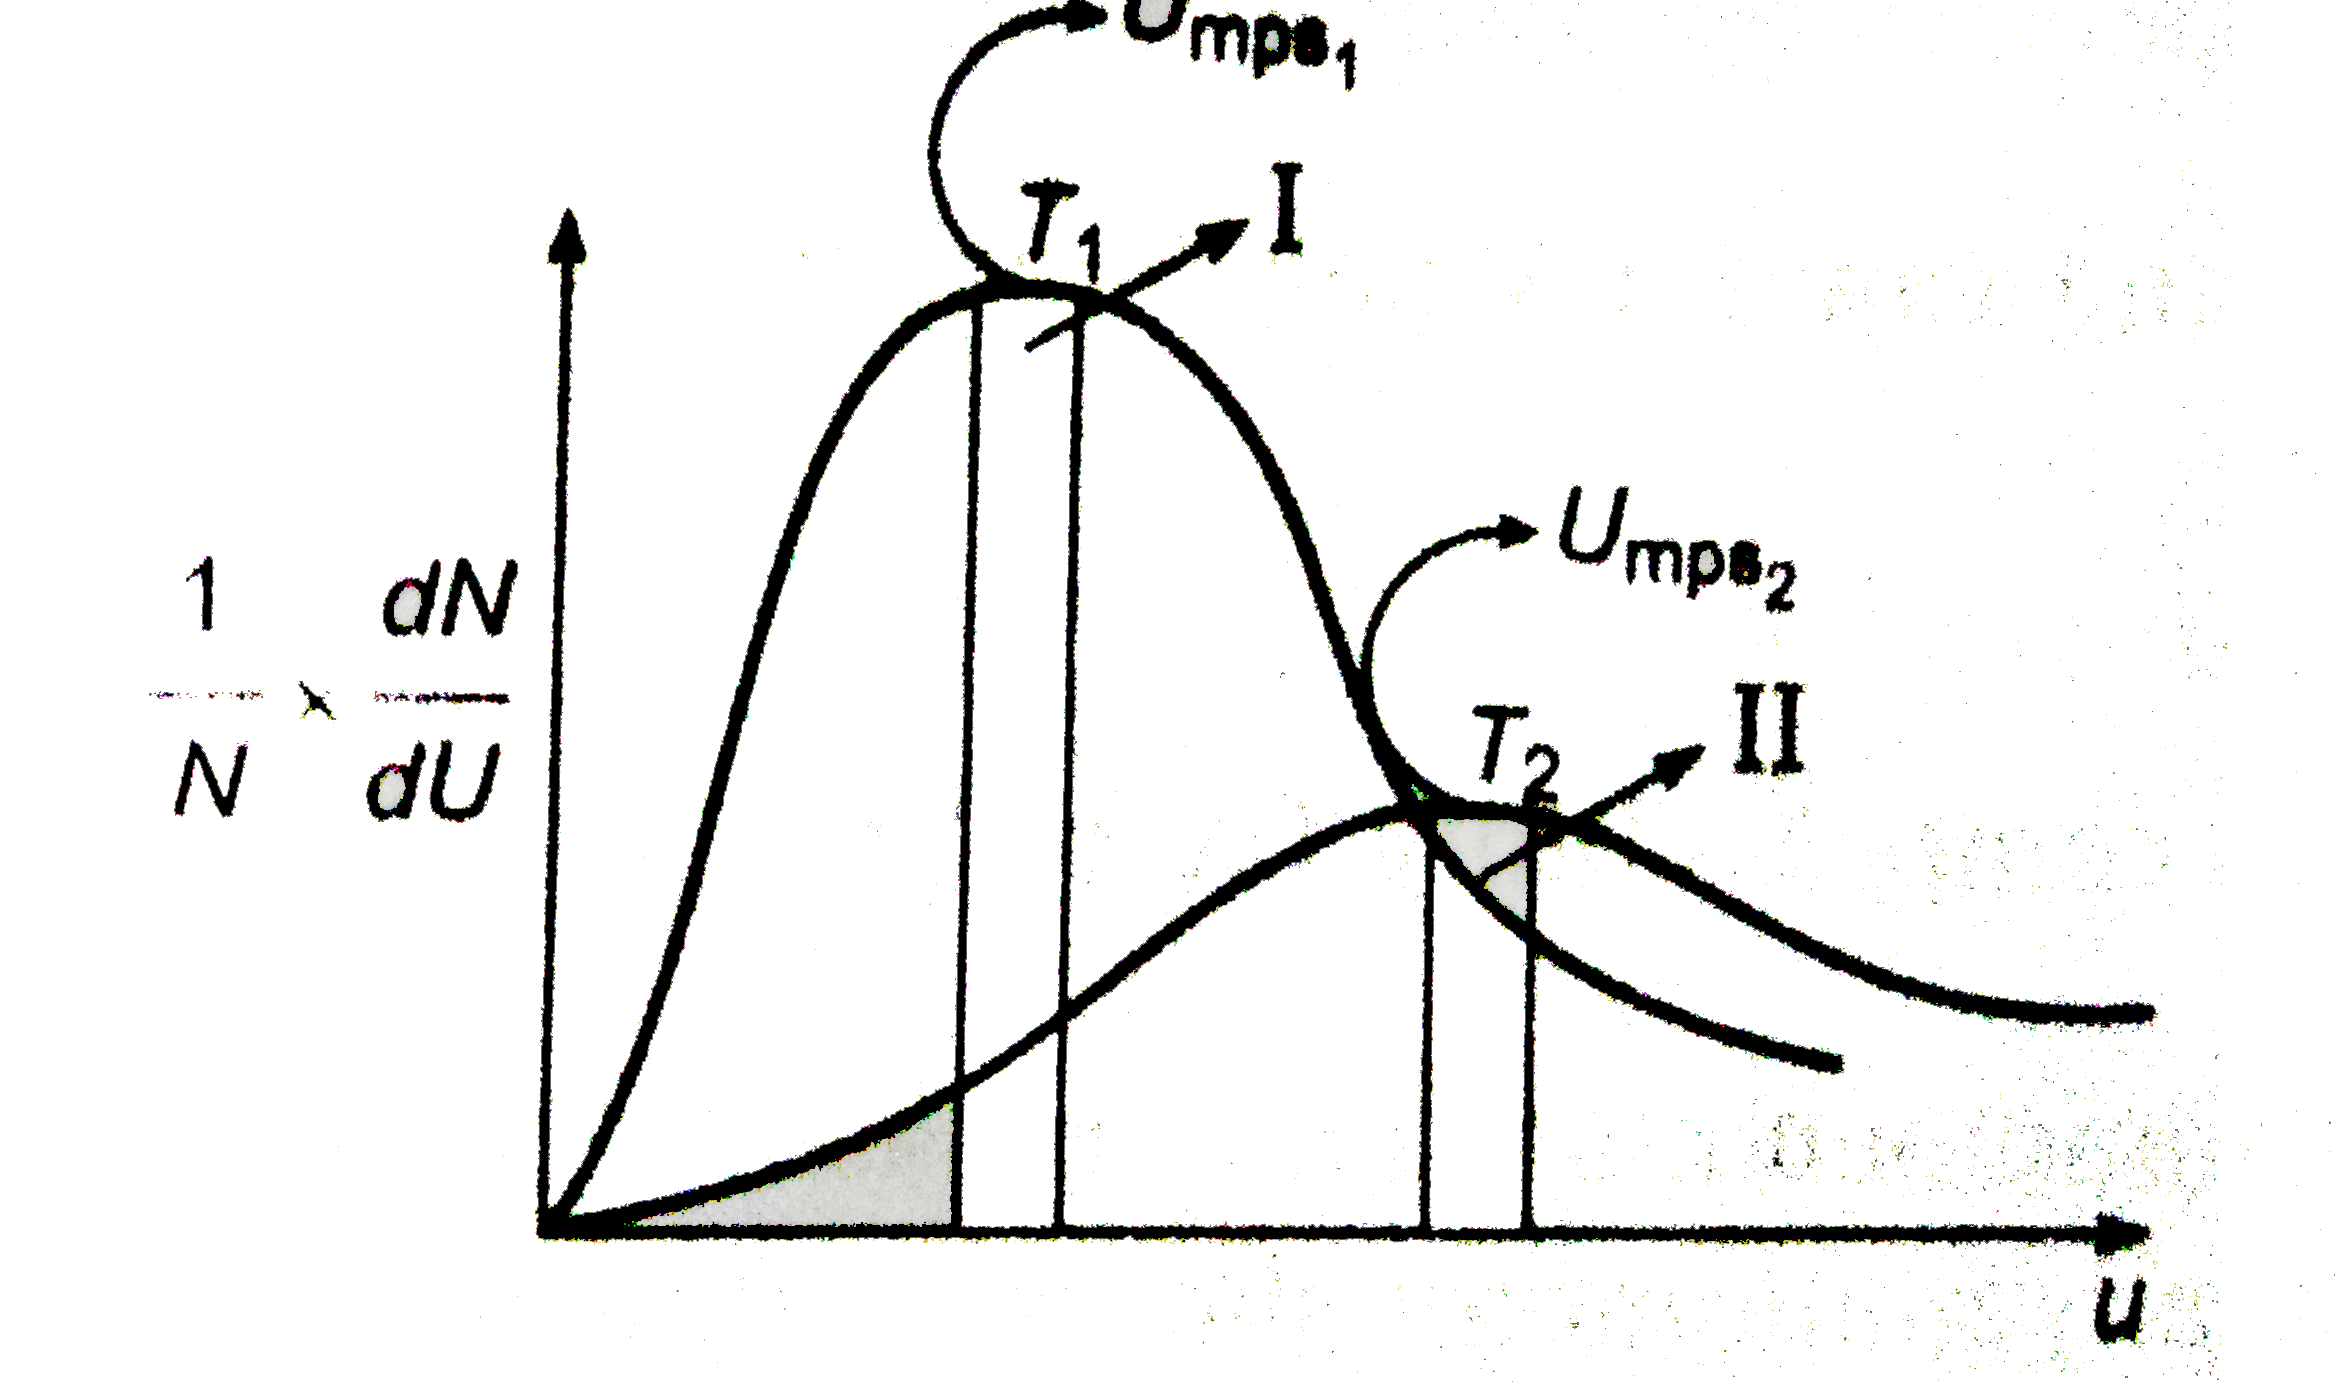
Following represents the Maxwell distribution curve for an ideal gas at two temperature T1 and T2 . Which of the following option(s) is/are true?
 View Solution


