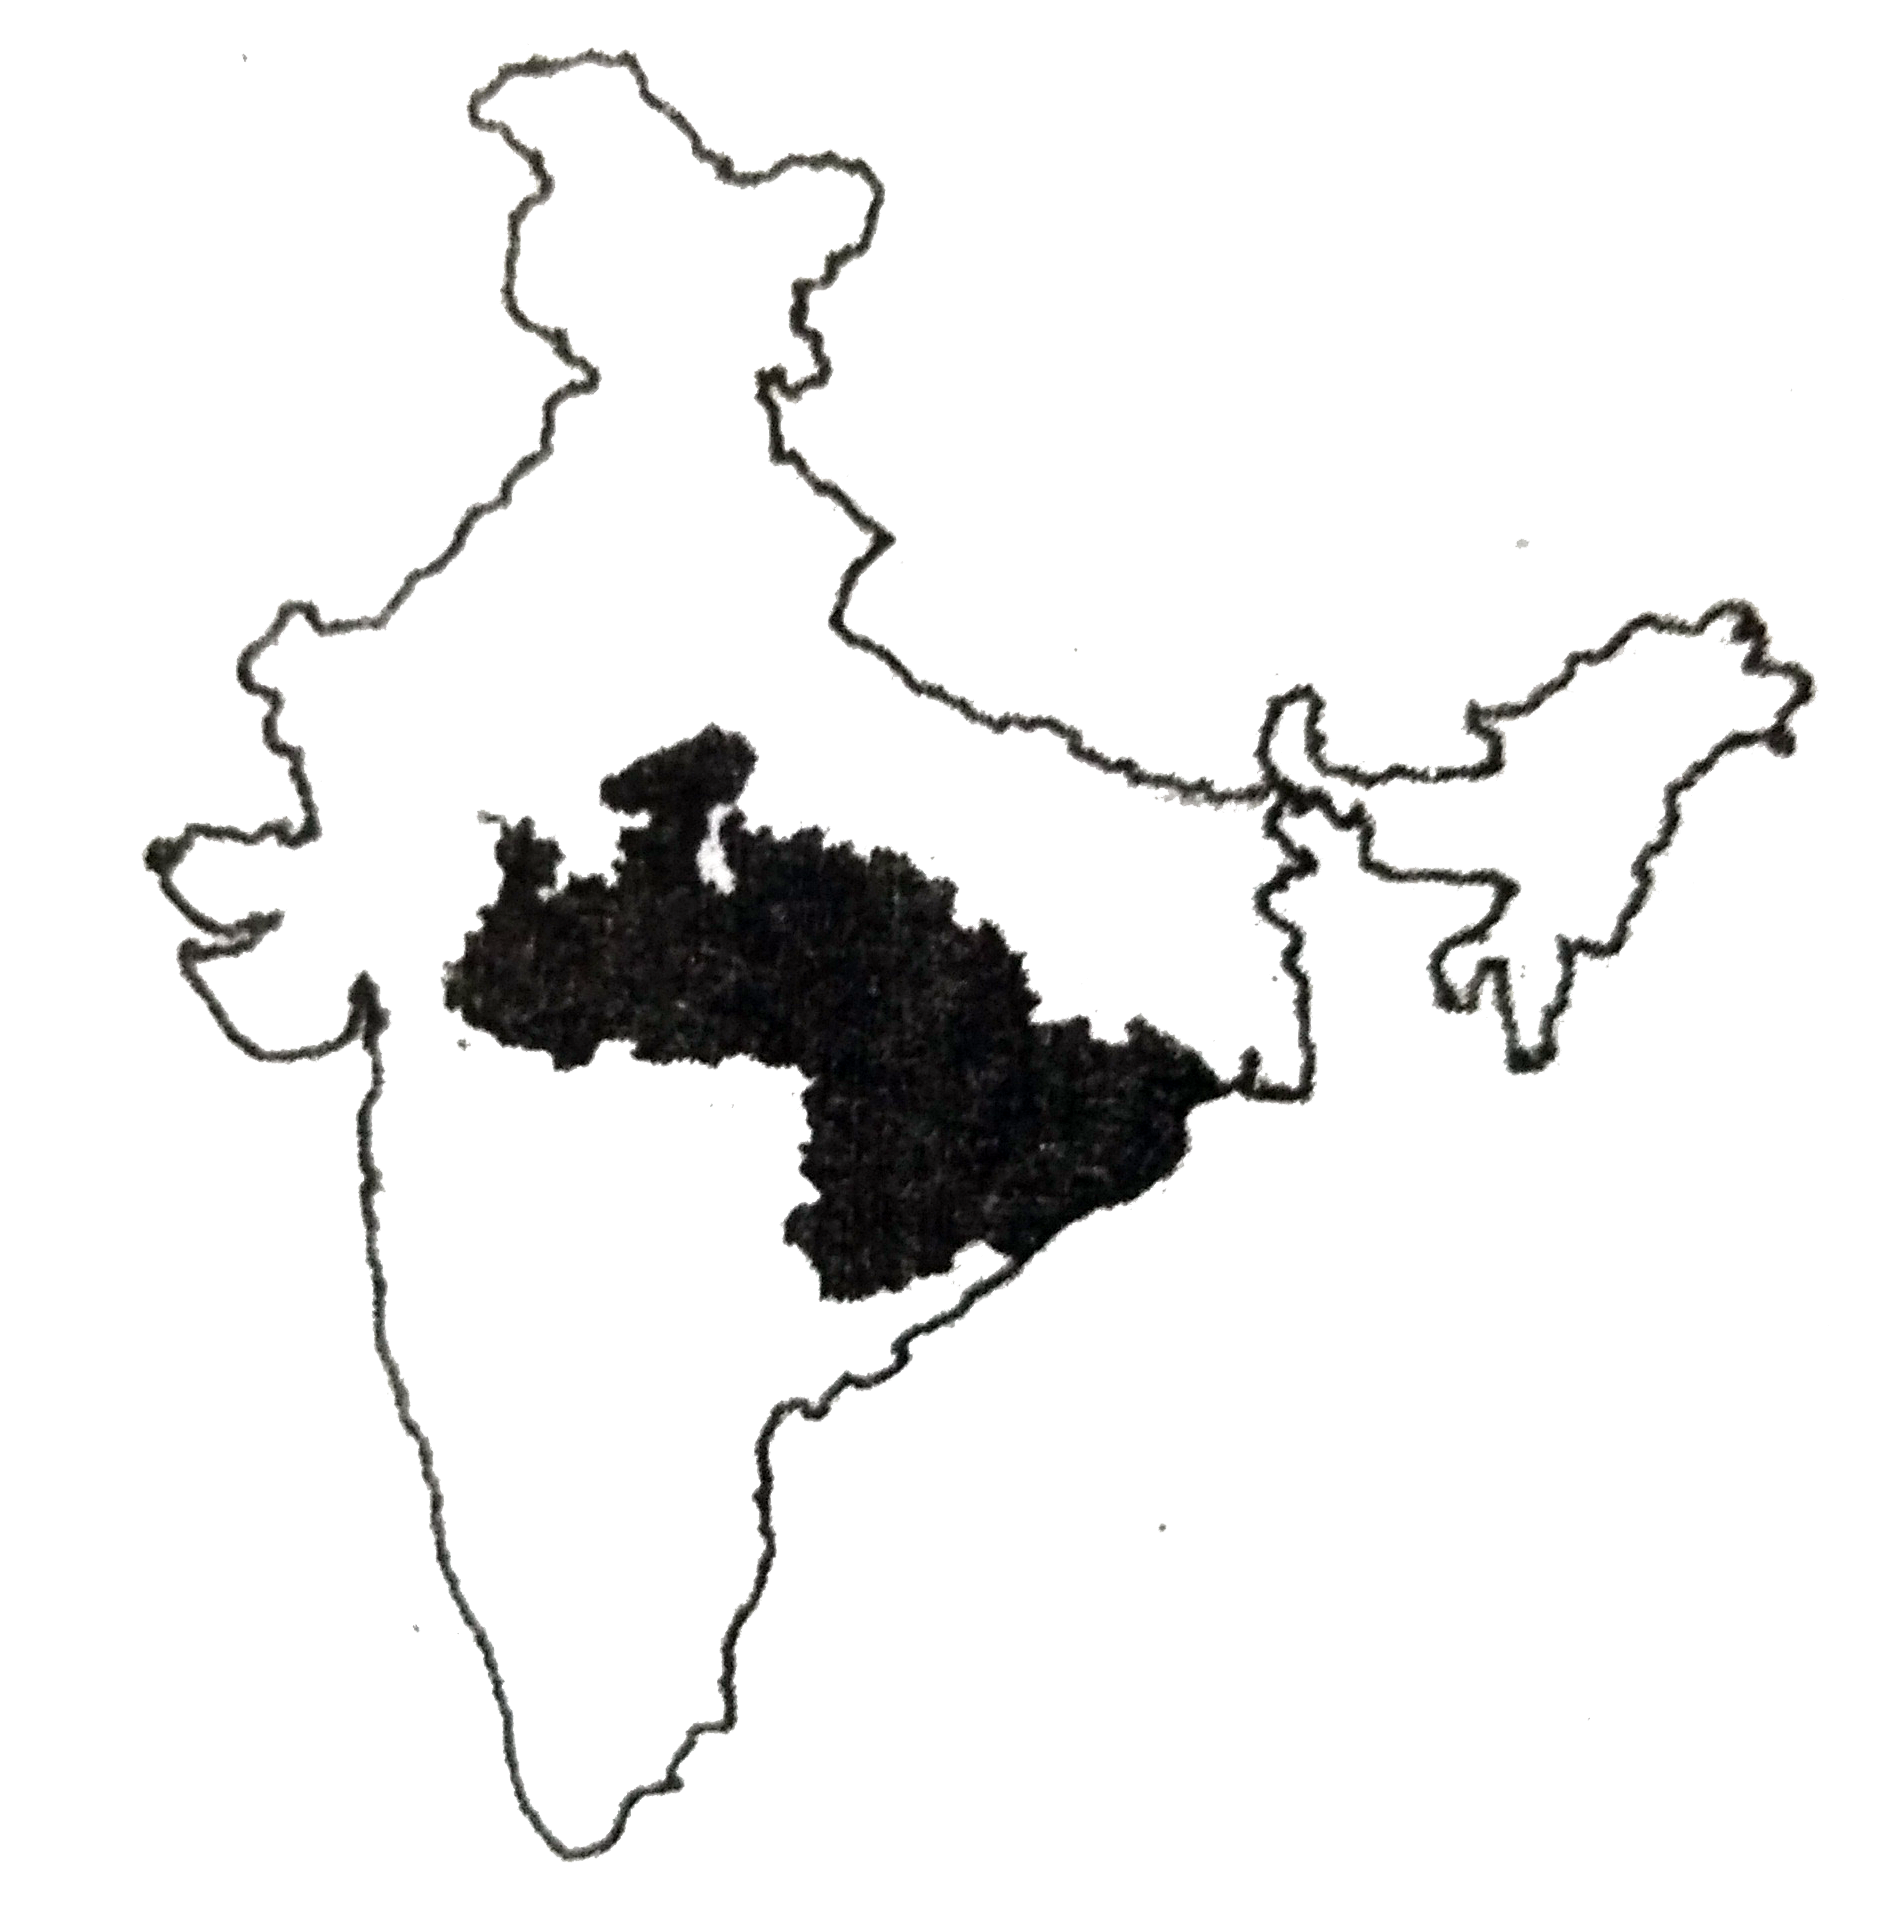
In the map given above, what is the population density in the region represented by the shaded area ?
A
Below 100 persons per sq. km
B
100 to 300 persons per sq. km
C
300 to 500 persons per sq. km
D
Above 500 persons per sq. km
Text Solution
The correct Answer is:B
Population density is defined as the number of persons per square kilometre. In 2001, the density of population in India was 324 persons per kilometer. Shaded area shows the regions of Madhya Pradesh Chhattisgarh and Orissa.
|
Topper's Solved these Questions
Similar Questions
Knowledge Check
The shaded region is represented by the inequation:
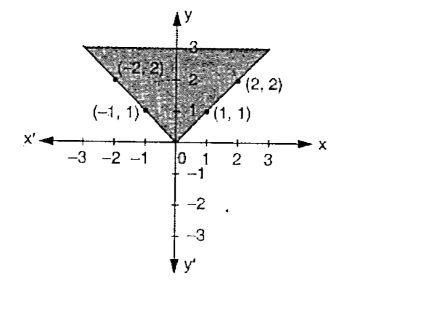 Ay≥xBy≥−xCy≥|x|Dy≤|x|
The shaded region is represented by the inequality:
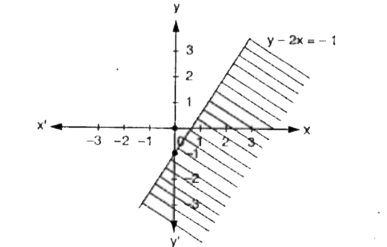 Ay−2x≤−1Bx−2y≤−1Cy−2x≥−1Dx−2y≥−1
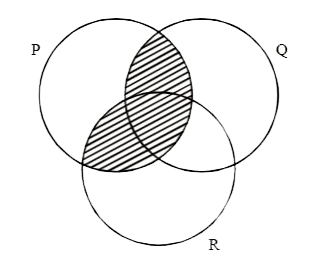
What does the shaded region represent in the figure given below ?
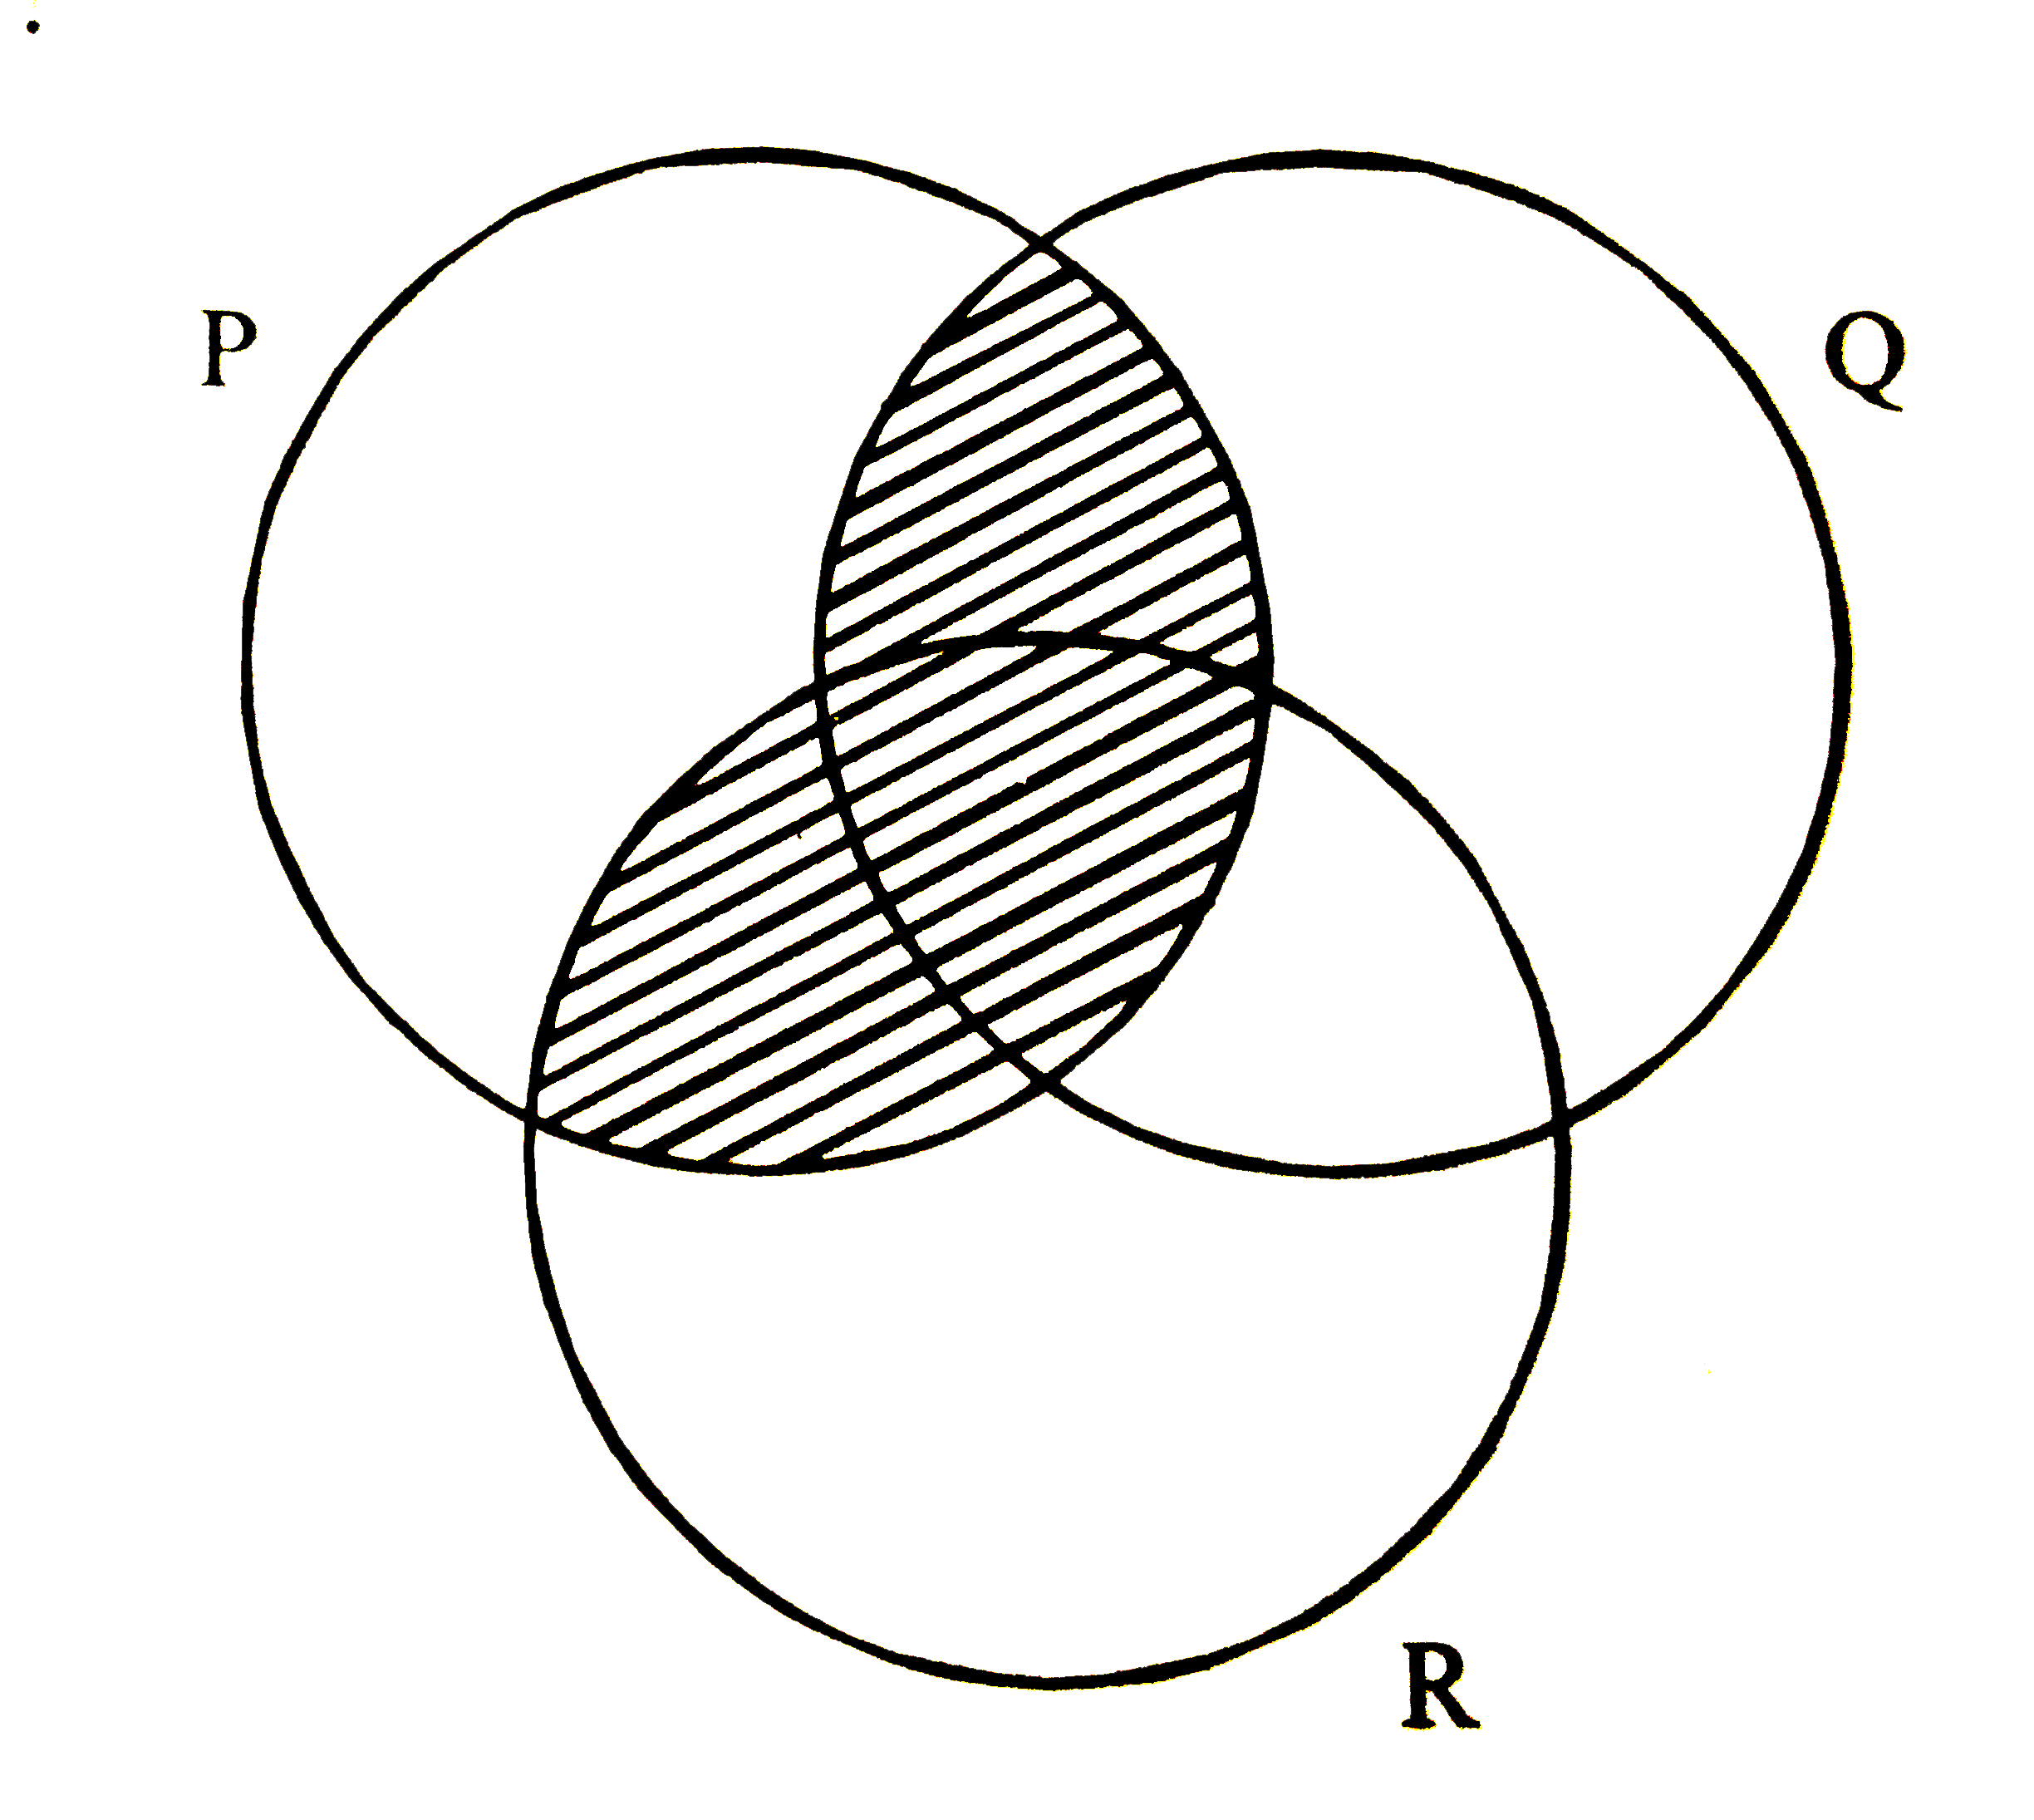 A(P∪Q)−(P∩Q)BP∩(Q∪R)C(P∩Q)∩(P∩R)D(P∩Q)∪(P∩R)
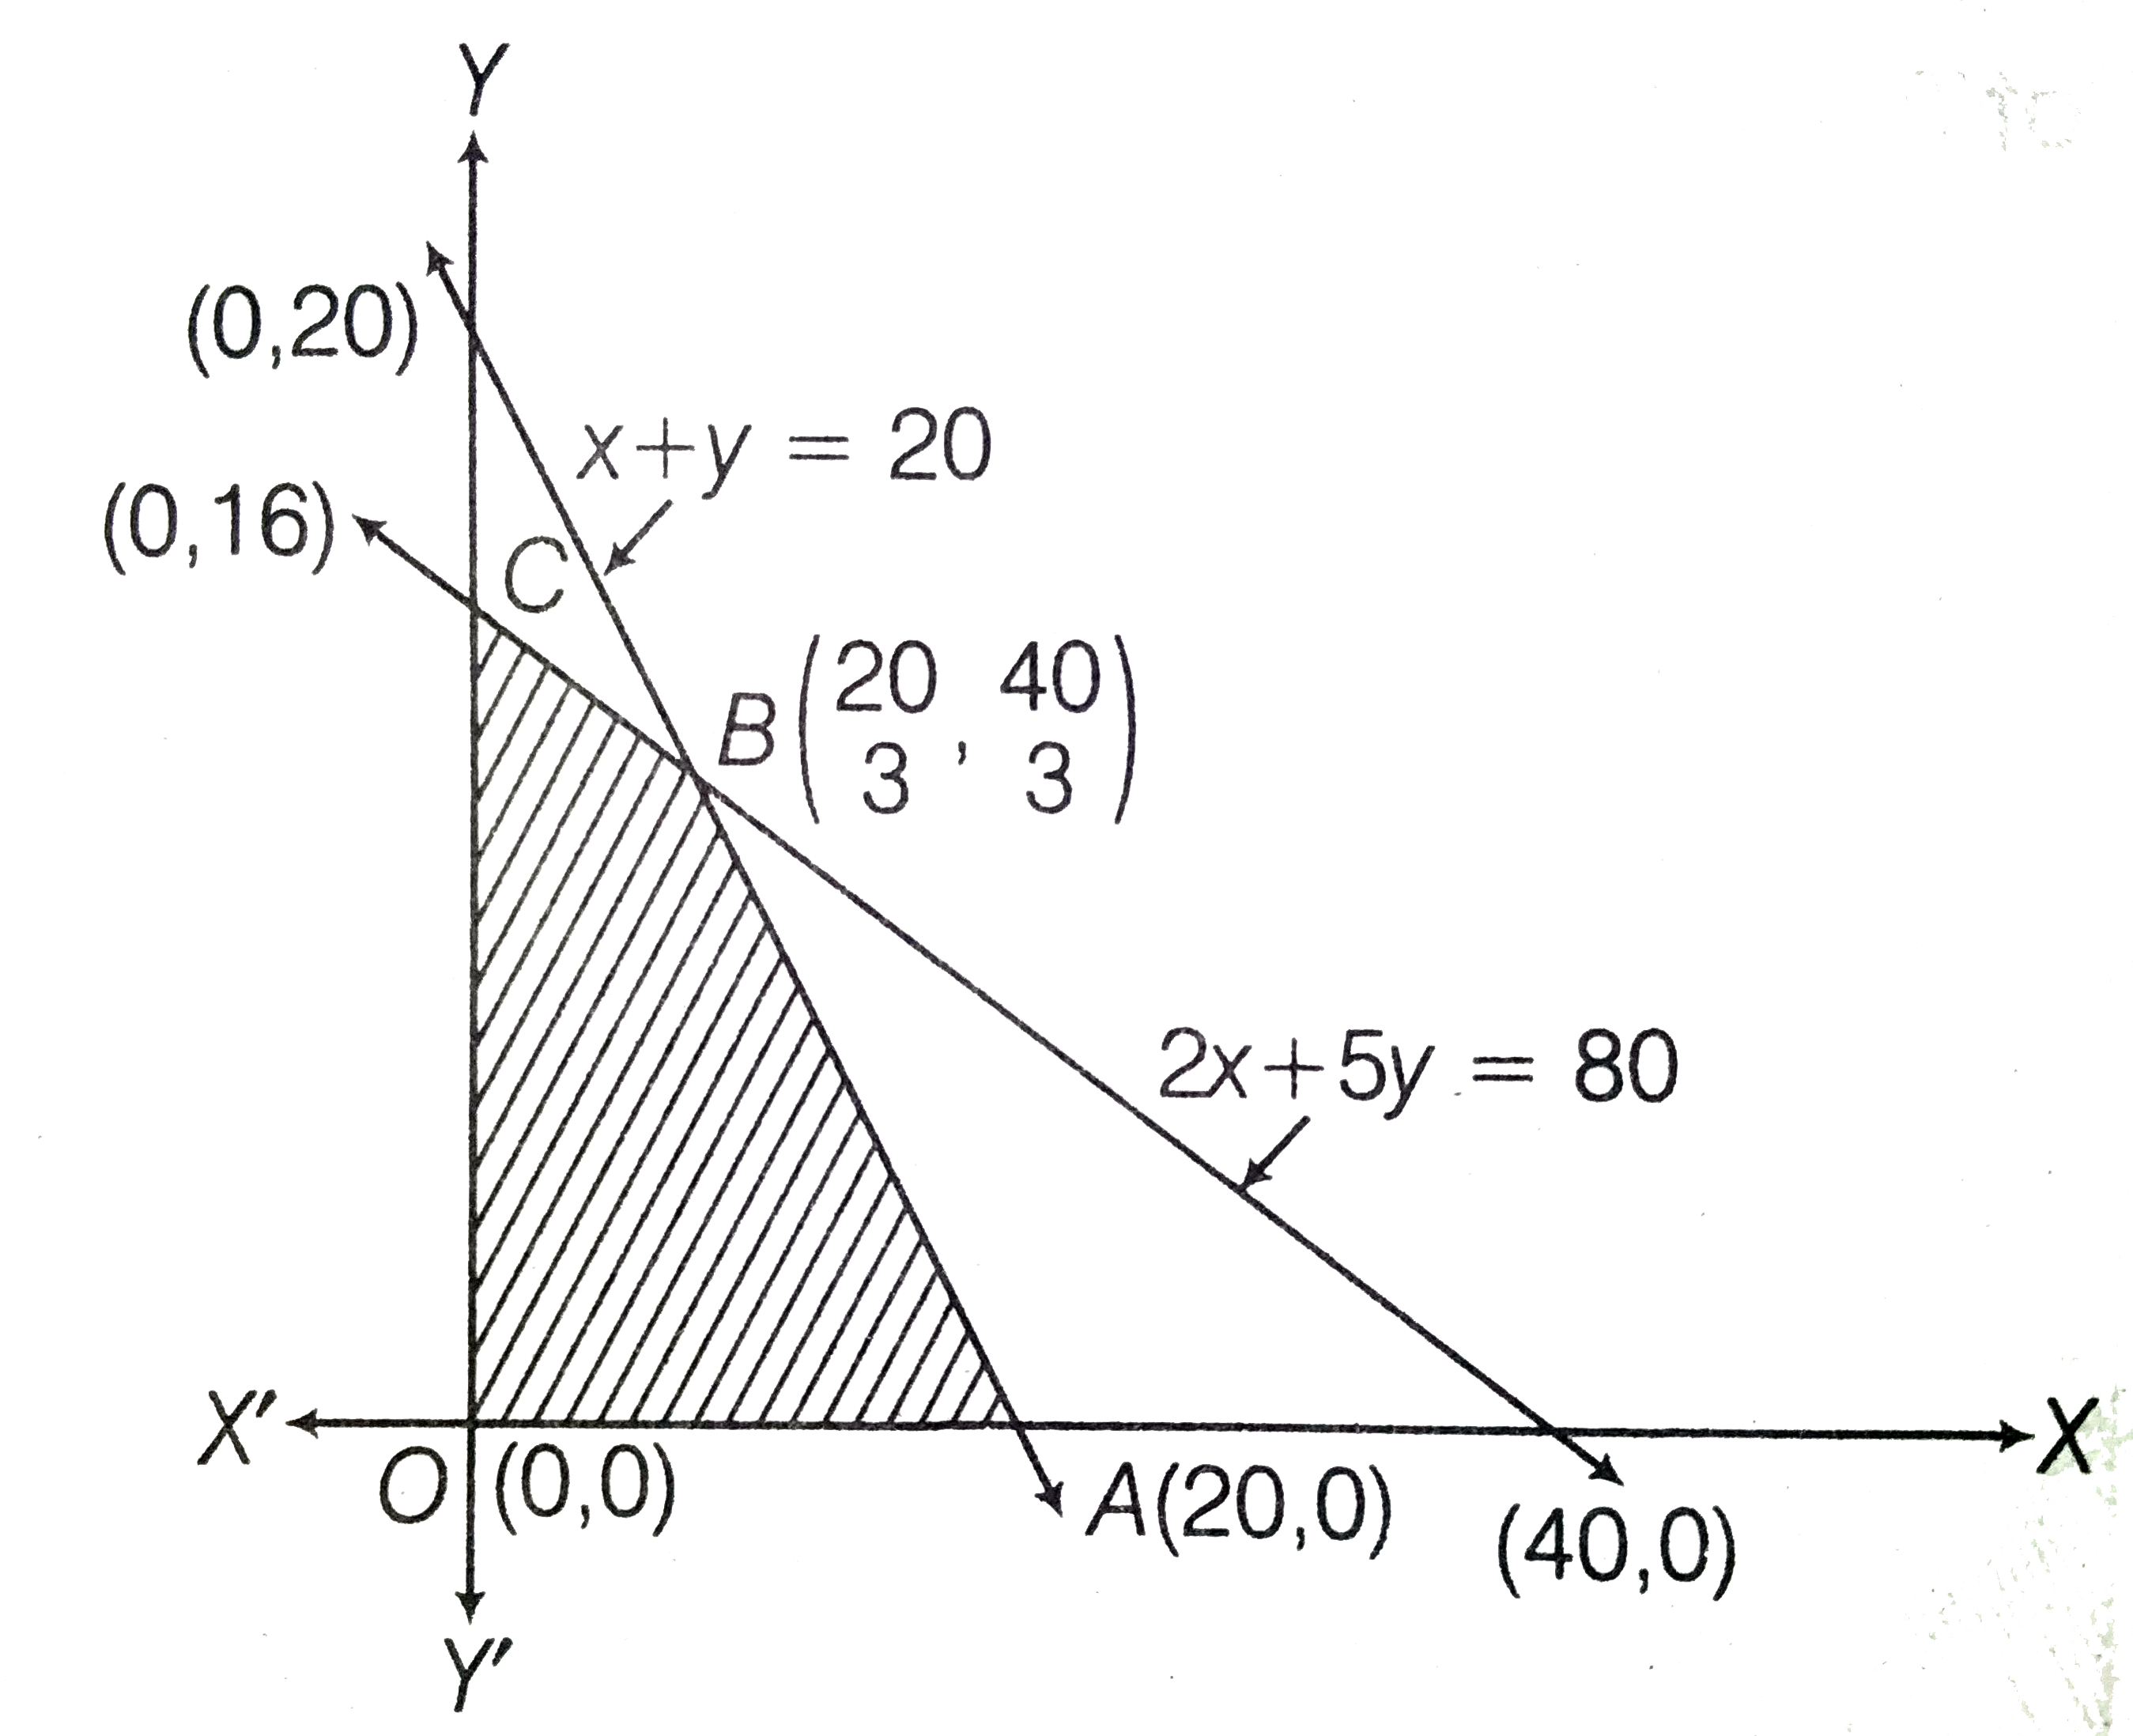
Shaded region is represented by , the constraints
View Solution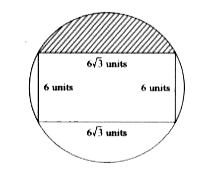
In the given figure, what is the area of the shaded region ?
View Solution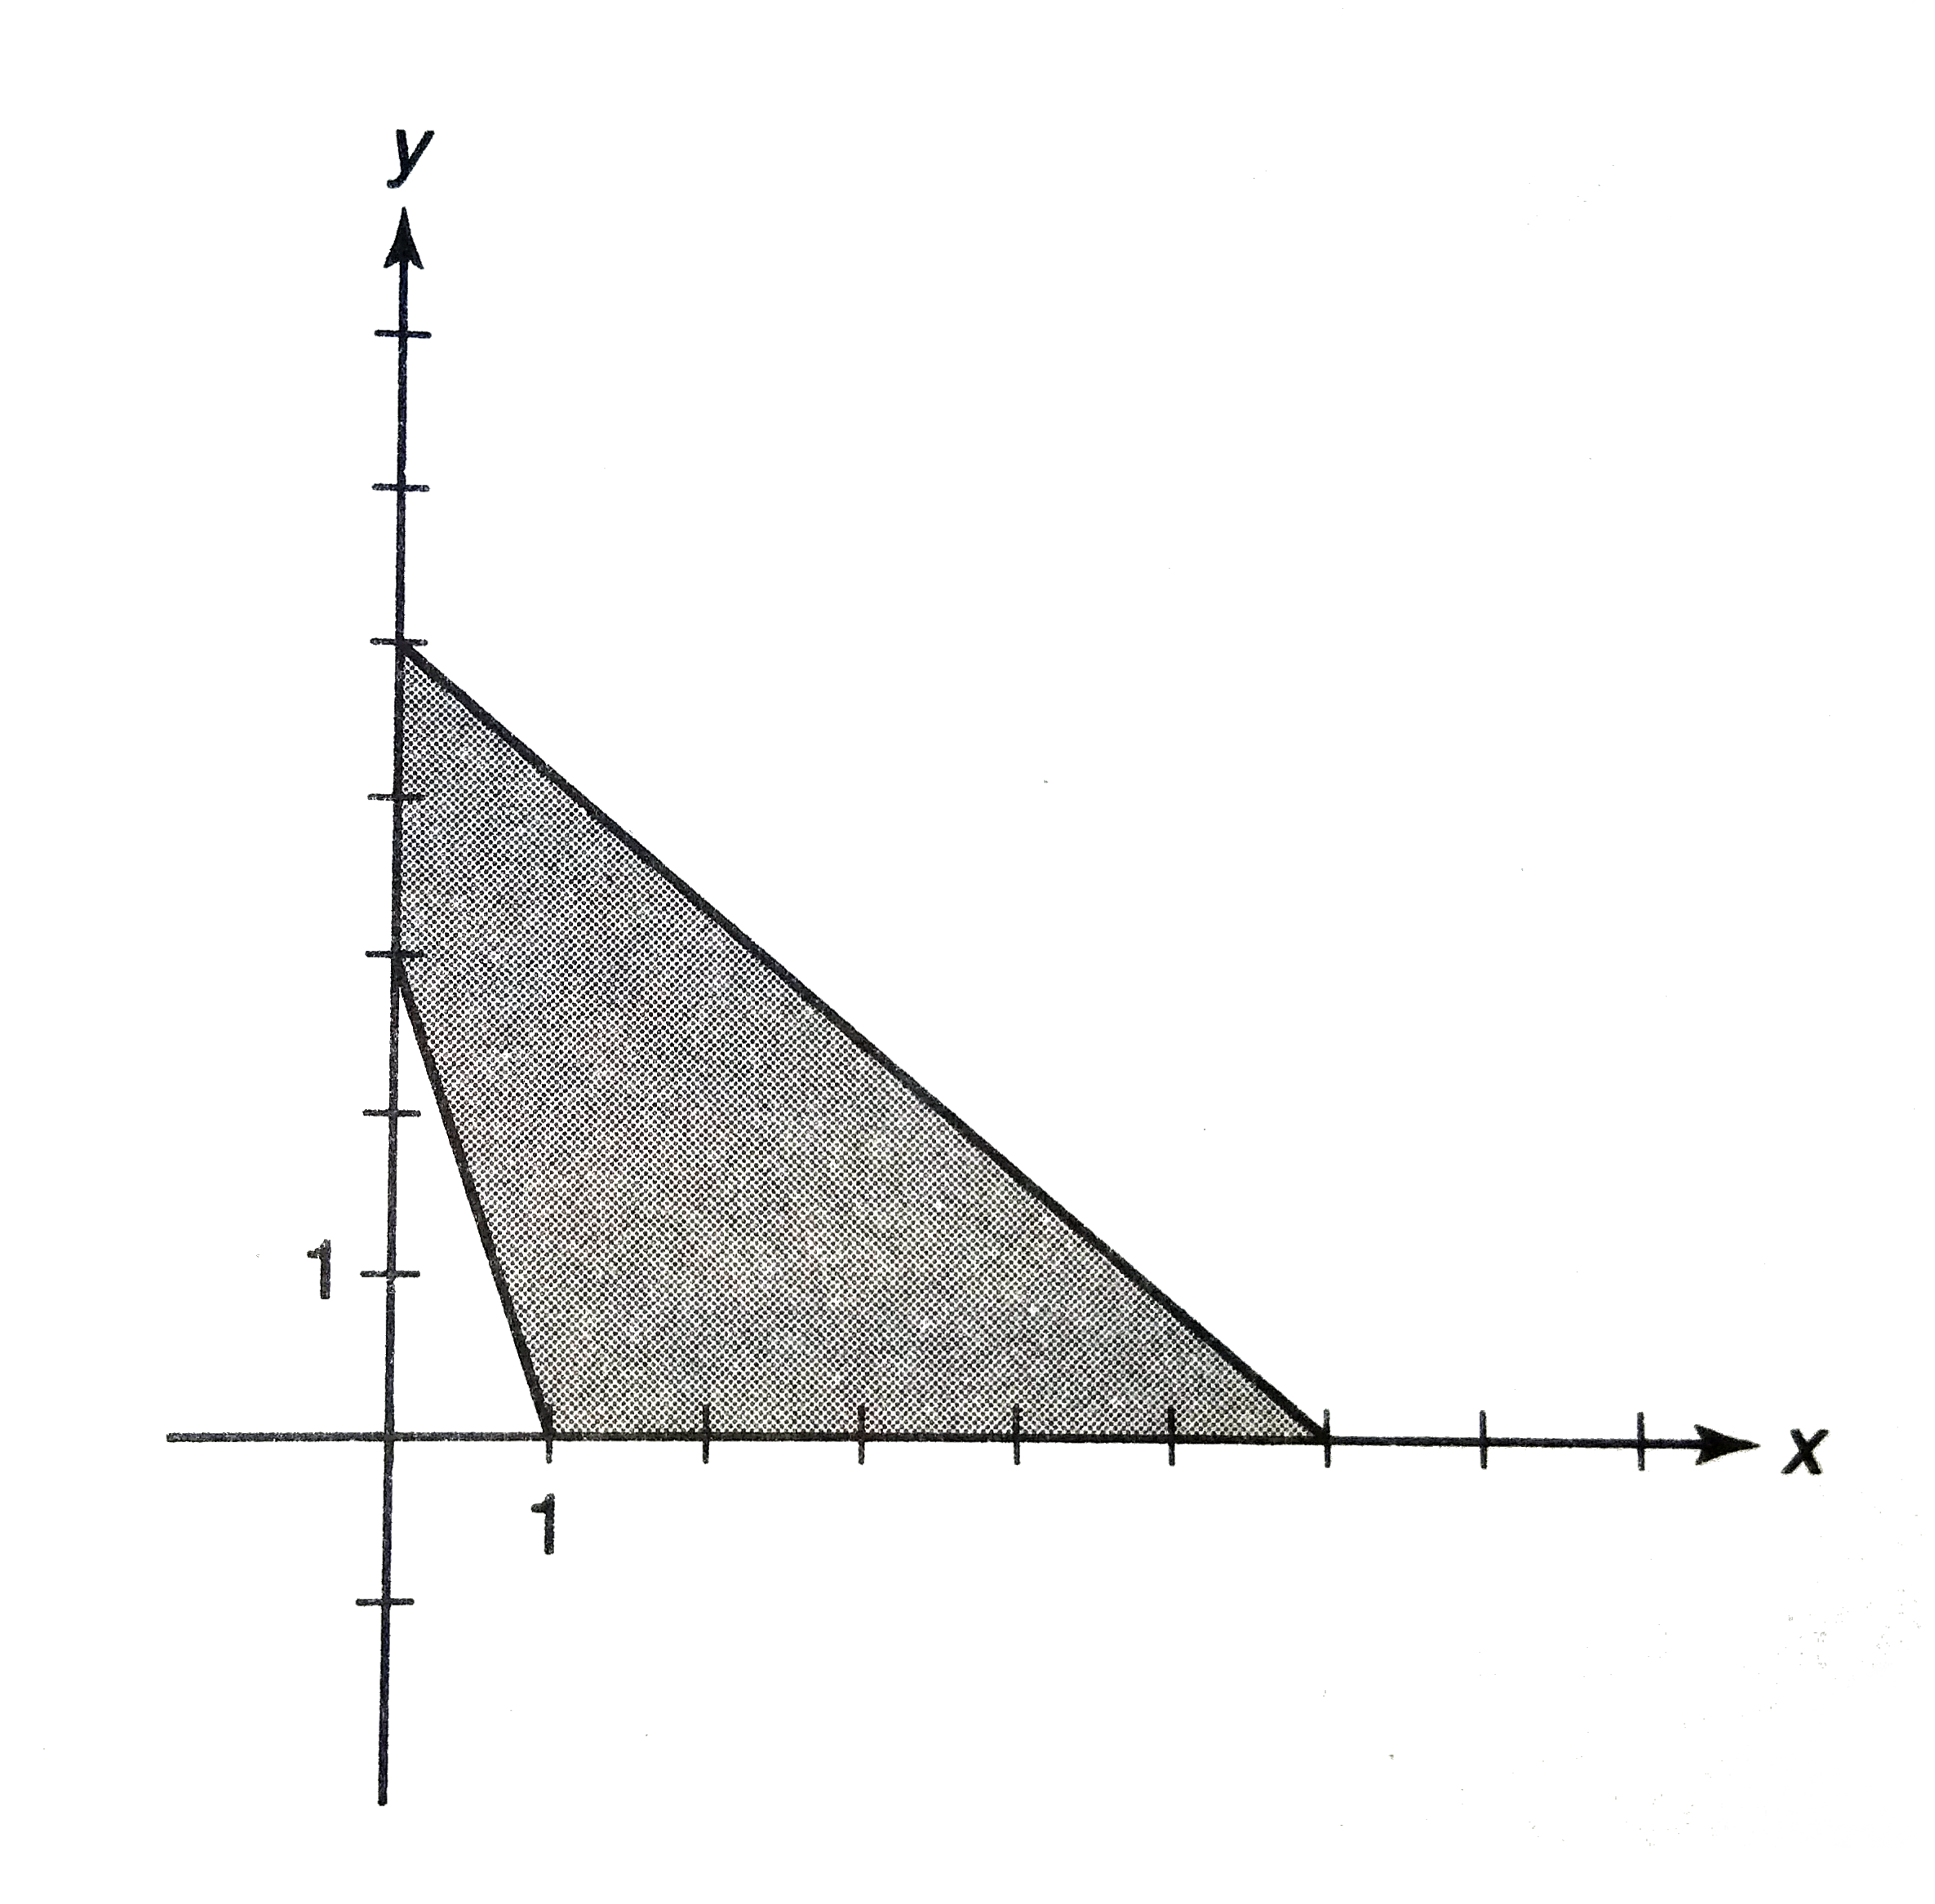
In the figure above, what is the number of square units in the area of the shaded region?
View SolutionWhat does the shaded region represent in the figure given below ?

View SolutionWhat does the shaded region represent in the figure given below?
View Solution

