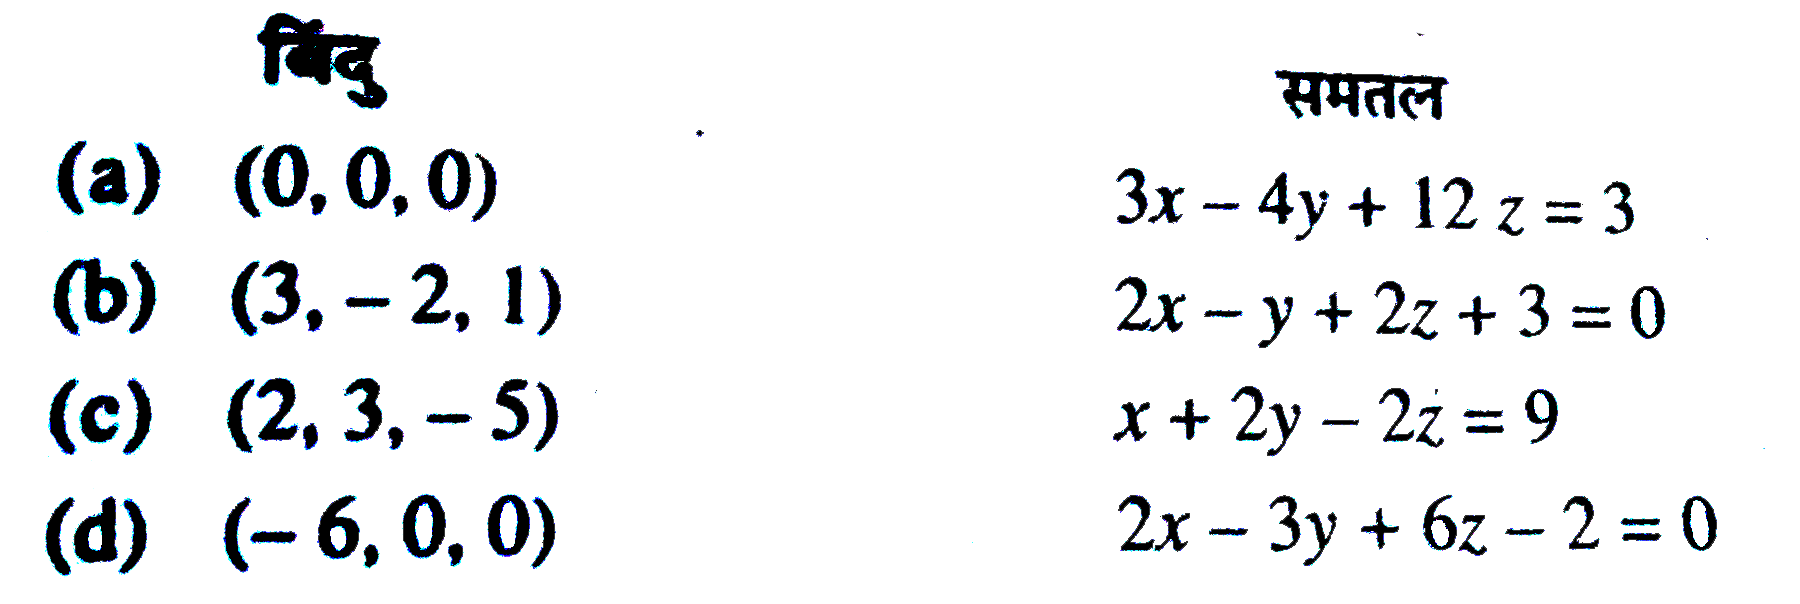
निम्नलिखित प्रश्नो में प्रत्येक दिए गए बिंदु से दिए समतलों कि दुरी कीजिए l

The correct Answer is:(a)313 (b)133
(C ) 3 (d)2
Step by step video & image solution for निम्नलिखित प्रश्नो में प्रत्येक दिए गए बिंदु से दिए समतलों कि दुरी कीजिए l by Maths experts to help you in doubts & scoring excellent marks in Class 12 exams.
Topper's Solved these Questions
- BOOK - NCERT HINDICHAPTER - त्रि - विमीय ज्यामिति EXERCISE - अध्याय 11 पर विविध प्रश्नावली23videos
त्रि - विमीय ज्यामिति
- BOOK - NCERT HINDICHAPTER - त्रि - विमीय ज्यामिति EXERCISE - प्रश्नावली 11.217videos
त्रि - विमीय ज्यामिति
- BOOK - NCERT HINDICHAPTER - गणितीय मॉडलिंगEXERCISE - उदहारण7videos
गणितीय मॉडलिंग
- BOOK - NCERT HINDICHAPTER - पूरक पाठय सामग्री EXERCISE - प्रश्नावली 10.57videos
पूरक पाठय सामग्री
Similar Questions
दिखाइए कि मूल बिंदु से (2,1,1) मिलाने वाली रेखा , बिन्दुओ (3,5,−1) और (4,3,−1) से निर्धारित रेखा पर लंब है l
01:37View Solutionदर्शाइए कि दिक्-कोसाइन 1213,−313,−413,413,1213,313,313,−413,1213 वाली तीन रेखाएँ परस्पर लंबवत है |
06:07View Solutionगणितीय निर्देशन के प्रयोग द्वारा एक दी गई मीनार की ऊंचाई ज्ञात कीजिये !
02:11View Solutionयदि →a=ˆi−2ˆj+3ˆk,→b=2ˆi−3ˆj+ˆk और c=3ˆi+ˆj−2ˆk, है , तो [→a→b→c] ज्ञात कीजिए l
01:31View SolutionHow many lines of symmetry does the above figure have ?
02:45View SolutionWhich of the following are correct chain isomers of butane ? (i)
02:17View SolutionDetermine the point of symmetry of a regular hexagon.
05:41View SolutionDtermine the images of the following figure about the given line :
02:21View SolutionMatch the following Column A to Column B
 02:03View Solution
Match the following Column A to Column B
 02:10View Solution
Match the following Column A to Column B
 02:17View Solution
Find the area of the figure given below.
 02:10View Solution
The area of the shaded part in the figure given below is ______.
 04:23View Solution
The inequation represented by the graph given below is :
01:13View SolutionThe inequation that best describes the graph given below is _________
03:12View SolutionThe inequation that best describes the following graph is _________
05:46View Solution

