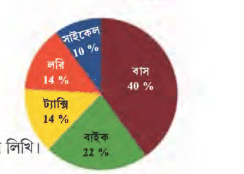
সকাল 11 টা থেকে 12 টা পর্যন্ত রাস্তায় যানবাহনের চলার চিত্র পাওয়া যায় | কোন দুটি গাড়ি সমান সংখ্যায় চলেছে ?
Step by step video & image solution for সকাল 11 টা থেকে 12 টা পর্যন্ত রাস্তায় যানবাহনের চলার চিত্র পাওয়া যায় | কোন দুটি গাড়ি সমান সংখ্যায় চলেছে ? by Maths experts to help you in doubts & scoring excellent marks in Class 8 exams.
Updated on:21/07/2023Topper's Solved these Questions
- পাই চিত্রBOOK - NCERT BANGLISH (BANGLISH MEDIUM)CHAPTER - পাই চিত্রEXERCISE - EXERCISE
11 Videos
- ত্রৈরাশিকBOOK - NCERT BANGLISH (BANGLISH MEDIUM)CHAPTER - ত্রৈরাশিকEXERCISE - EXERCISE
4 Videos
- পূরক কোণ,সম্পূরক কোণ ,সন্নিহিত কোণBOOK - NCERT BANGLISH (BANGLISH MEDIUM)CHAPTER - পূরক কোণ,সম্পূরক কোণ ,সন্নিহিত কোণEXERCISE - EXERCISE
15 Videos
Similar Questions
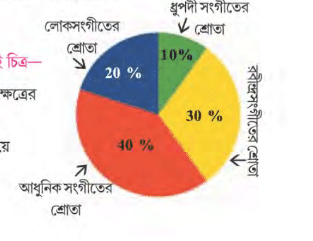
নীচের পাই চিত্র দেখো ও প্রশ্নের উত্তর দাও - শ্রোতারা কোন কোন ধরনের গান পছন্দ করেন তার পাই চিত্র দেওয়া হলো- পাই চিত্র থেকে কোন ধরনের গানের শ্রোতা সবচেয়ে বেশি ?

View Solution(a) নীচের পারস্পরিক সম্পর্কটি দেখো ত্রৈরাশিক পদ্ধতিতে উত্তর দাও |

View Solutionমনে মনে ভাবো এবং লেখোঃ দুটি স্থূল কোণ পরস্পর সম্পূরক হতে৩ পারে কি না লেখো|
View SolutionHow many lines of symmetry does the above figure have ?
View SolutionWhich of the following are correct chain isomers of butane ? (i)
View SolutionDetermine the point of symmetry of a regular hexagon.
View SolutionDtermine the images of the following figure about the given line :
View SolutionMatch the following Column A to Column B

View SolutionMatch the following Column A to Column B

View SolutionMatch the following Column A to Column B

View SolutionFind the area of the figure given below.

View SolutionThe area of the shaded part in the figure given below is ______.

View SolutionThe inequation represented by the graph given below is :
View SolutionThe inequation that best describes the graph given below is _________
View SolutionThe inequation that best describes the following graph is _________
View SolutionWhich inequations represent the shaded region in the given figure
View Solution
