Direction : Study the following bar diagram carefully and answer the four questions.
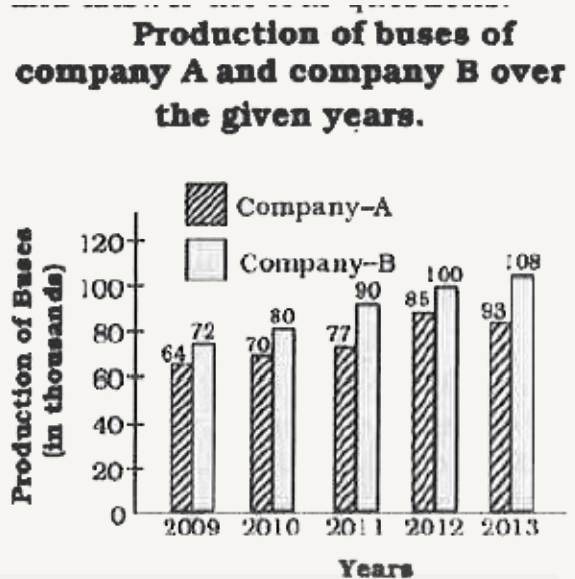
The average production (in thousand) of the company B over the years 2009, 2011, 2012, 2013 is
87.33
80.67
90.33
84
The correct Answer is:A
Step by step video & image solution for Direction : Study the following bar diagram carefully and answer the four questions. The average production (in thousand) of the company B over the years 2009, 2011, 2012, 2013 is by Maths experts to help you in doubts & scoring excellent marks in Class 14 exams.
Updated on:21/07/2023Similar Questions
Direction : Study the following bar diagram carefully and answer the four questions.
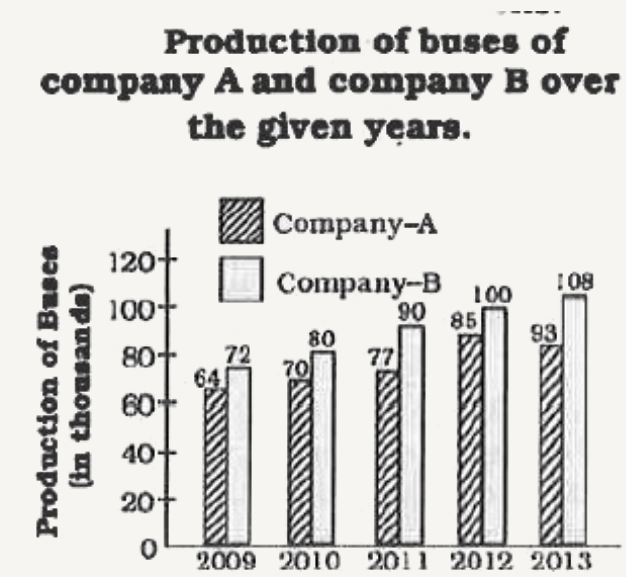
The average production (in thousand) of company A over the years 2010, 2011, 2012, 2013 is
View SolutionStudy the following bar-diagram carefully and answer the questions.
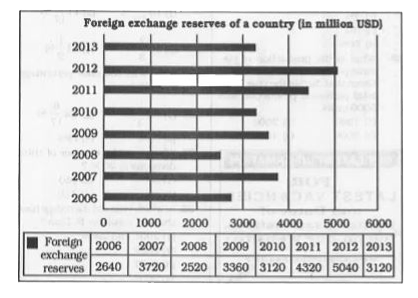
What was the percentage increase in the foreign reserve in 2012 over 2008?
View Solution
Knowledge Check
Study the following bar diagram carefully and answer the four questions.
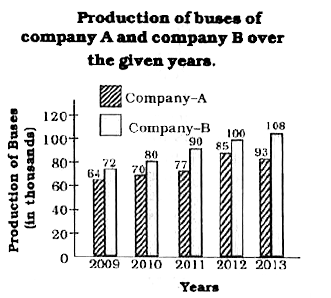
The average production (in thousand) of the company B over the years 2009, 2011, 2012 isA87.33B80.67C90.33D84Direction : Study the following bar diagram carefully and answer the four questions.

The average production (in thousand) of company A over the years 2010, 2011, 2012, 2013 isA74B81.25C85.5D81Study the following graph carefully and answer the questions that follow
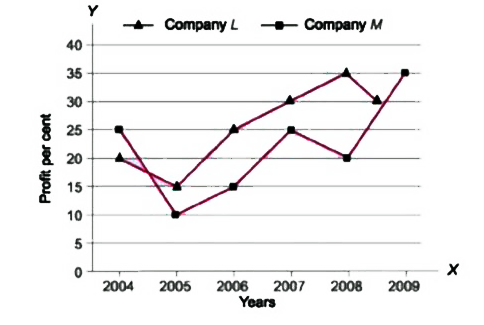
What was the average per cent rise in profit of company L over all the years together ?ANone of the aboveB1513C1856D2156s
Study the following bar-diagram carefully and answer the questions.
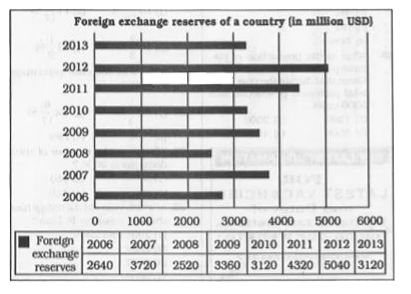
The foreign exchange reserve in 2012 was how many times that in 2009?
View SolutionDirection : Study the following bar diagram carefully and answer the four questions.
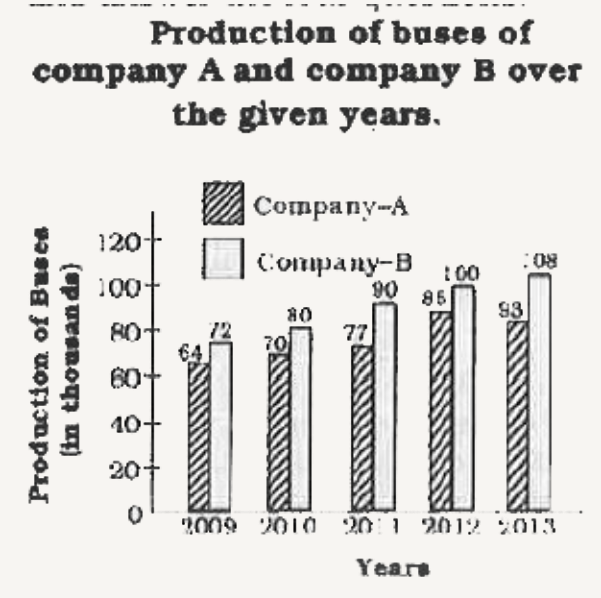
In which year for the company A the percentage increase of production of buses with respect to the previous year is maximum?
View SolutionStudy the following graph carefully and answer the questions that
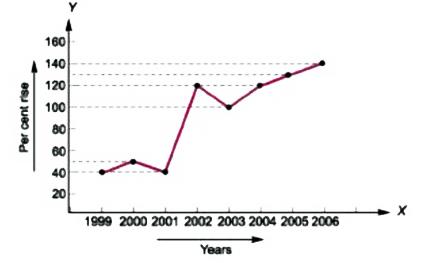
What was the average of percent rise over the given years ?
View SolutionStudy the following bar diagram carefully and answer the four questions.
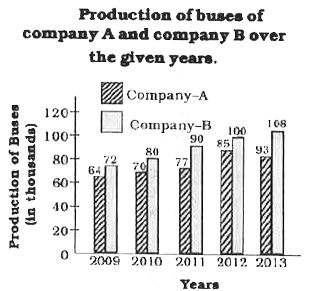
The ratio of the average production of company A in 2009 and 2010 to the average production of company B in the same years is
View SolutionStudy the graph carefully and answer the following questions.
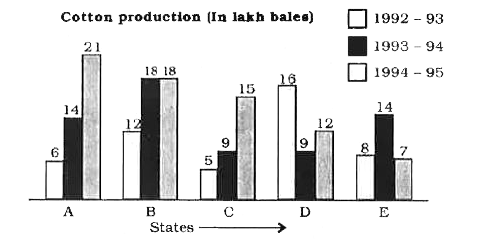
What is the average production of the four states in the year 1994-95 taken together ?
View Solution