Which one of the figures gives the temperature dependance of density of water correctly?
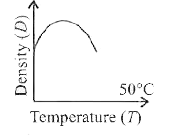
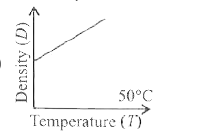
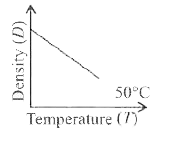
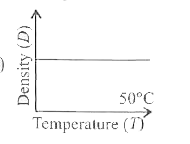
The correct Answer is:A
To determine which figure correctly represents the temperature dependence of the density of water, we need to analyze the behavior of water as it is heated from ice to liquid water.
1. Understanding the Phase Change:
- When ice is heated, it first melts at 0°C. The density of ice is lower than that of liquid water, which is why ice floats on water.
Hint: Remember that ice and water have different densities due to the arrangement of molecules.
2. Behavior of Water from 0°C to 4°C:
- As we continue to heat water from 0°C to 4°C, the density of water actually increases. This is an unusual property of water; typically, substances expand when heated, but water behaves differently in this temperature range.
Hint: Consider how molecular structure changes with temperature and how it affects density.
3. Maximum Density at 4°C:
- At 4°C, water reaches its maximum density. This is a critical point in understanding the graph. The density of water is highest at this temperature.
Hint: Identify the point on the graph where density peaks; this should correspond to 4°C.
4. Behavior of Water Above 4°C:
- When the temperature increases beyond 4°C, the density of water starts to decrease as it expands. This is consistent with the general behavior of most substances.
Hint: After 4°C, remember that increasing temperature leads to decreasing density.
5. Analyzing the Graphs:
- Now, we need to look at the provided figures. The correct graph should show:
- An increase in density as temperature rises from 0°C to 4°C.
- A peak at 4°C, where density is maximum.
- A decrease in density as the temperature continues to rise above 4°C.
Hint: Compare the graphs carefully to find the one that matches this behavior.
Conclusion:
The correct figure will show a curve that rises to a maximum at 4°C and then falls as the temperature increases further. This behavior is unique to water and is essential for understanding its thermal properties.
- When ice is heated, it first melts at 0°C. The density of ice is lower than that of liquid water, which is why ice floats on water.
- As we continue to heat water from 0°C to 4°C, the density of water actually increases. This is an unusual property of water; typically, substances expand when heated, but water behaves differently in this temperature range.
- At 4°C, water reaches its maximum density. This is a critical point in understanding the graph. The density of water is highest at this temperature.
- When the temperature increases beyond 4°C, the density of water starts to decrease as it expands. This is consistent with the general behavior of most substances.
- Now, we need to look at the provided figures. The correct graph should show:
- An increase in density as temperature rises from 0°C to 4°C.
- A peak at 4°C, where density is maximum.
- A decrease in density as the temperature continues to rise above 4°C.
The correct figure will show a curve that rises to a maximum at 4°C and then falls as the temperature increases further. This behavior is unique to water and is essential for understanding its thermal properties.
Topper's Solved these Questions
- BOOK - MTG-WBJEECHAPTER - HEAT AND THERMAL PHYSICSEXERCISE - WB JEE WORKOUT ( CATEGORY 2: SINGLE OPTION CORRECT TYPE )14videos
HEAT AND THERMAL PHYSICS
- BOOK - MTG-WBJEECHAPTER - HEAT AND THERMAL PHYSICSEXERCISE - WB JEE WORKOUT ( CATEGORY 2: ONE OR MORE THAN ONE OPTION CORRECT TYPE)11videos
HEAT AND THERMAL PHYSICS
- BOOK - MTG-WBJEECHAPTER - GRAVITATIONEXERCISE - WB JEE Previous Years Questions (CATEGORY 1: Single Option Correct Type7videos
GRAVITATION
- BOOK - MTG-WBJEECHAPTER - KINEMATICS EXERCISE - WB JEE Previous Years Questions (CATEGORY 3 : One or More than One Option Correct Type (2 Marks) )1videos
KINEMATICS
Similar Questions
Knowledge Check
- Question 1 - Select One
Which of the following lines correctly show the temperature dependence of equilibrium constant , for an exothermic reaction?
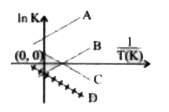 AA and BBB and CCC and DDA and D
 - Question 2 - Select One
Which of the following lines correctly show the temperature dependence of equilibrium constant, K, for an exothermic reaction ?
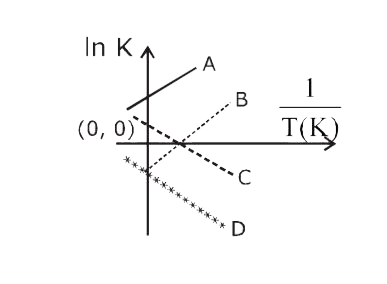 AA and DBA and BCB and CDC and D
 - Question 3 - Select One
Which of the following lines correctly show the temperatrue dependence equilibrium constant,K, for an exotehrmic reaction?
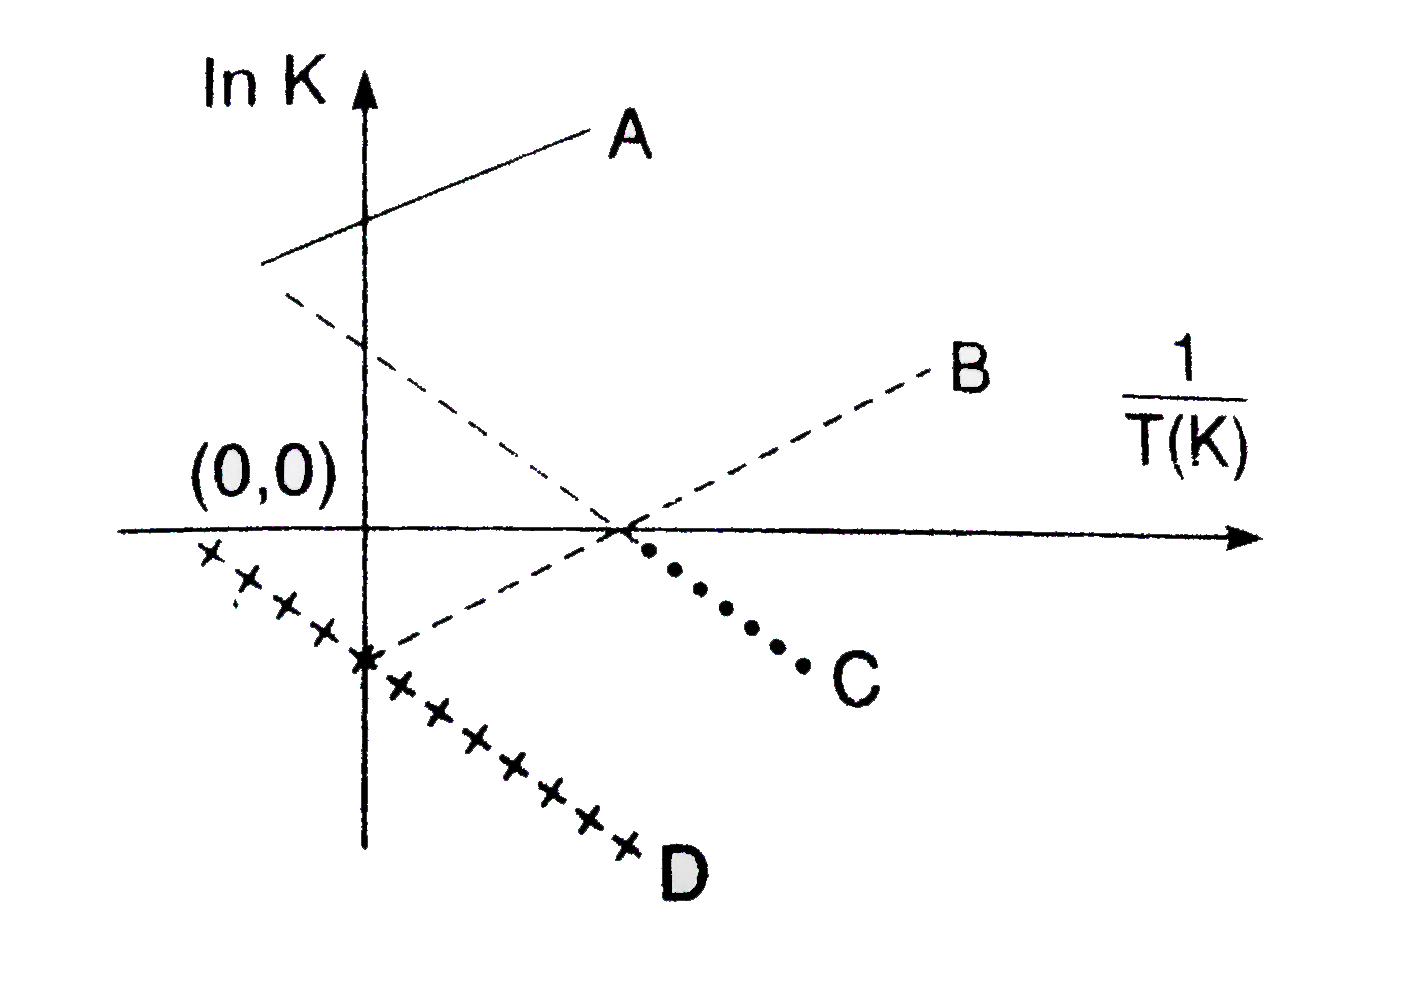 AA and DBA and BCB and CDC and D
Which of the following is dependent on temperature?
View SolutionWhich of the following is dependent on temperature?
View SolutionWhich of the following is dependent on temperature?
View SolutionWhich of the following is dependent on temperature?
View SolutionWhich of the following is dependent on temperature?
View Solution


