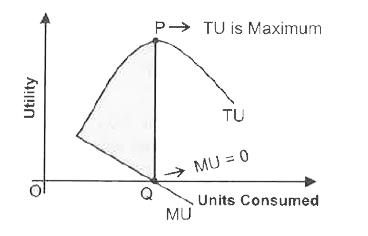
Explain with diagram , the relationship between TU and MU.

(i) When MU decreases, TU increases at a diminishing rate. ( As shown in figure till consumption level OQ ).
(ii) When MU is zero , TU is constant and maximum at P.
(iii) When MU is negative , TU starts diminishing.
Topper's Solved these Questions
- CONSUMER EQUILIBRIUM BOOK - FULL MARKSCHAPTER - CONSUMER EQUILIBRIUM EXERCISE - MORE QUESTIONS SOLVED (IV. TRUE OR FALSE) (Giving reasons, state whether the following statements are true or false. )
12 Videos
- CONSUMER EQUILIBRIUM BOOK - FULL MARKSCHAPTER - CONSUMER EQUILIBRIUM EXERCISE - MORE QUESTIONS SOLVED (V. LONG ANSWER TYPE QUESTIONS )
17 Videos
- CONSUMER EQUILIBRIUM BOOK - FULL MARKSCHAPTER - CONSUMER EQUILIBRIUM EXERCISE - MORE QUESTIONS SOLVED (II. MULTIPLE CHOICE QUESTIONS )
16 Videos
- COSTBOOK - FULL MARKSCHAPTER - COSTEXERCISE - NCERT TEXTBOOK QUESTIONS SOLVED
137 Videos
Similar Questions
Define utility. Explain the relationship between TU and MU curves
Or
Define utility Explain the law of DMU
Or
Explain the law of DMU with the help of an example.
Or
Explain the law of diminishing marginal utility using TV schedule.
View Solutionwhat is the relationship between MPC and MPS? Explain ?
View SolutionExplain the relationship between longitude and time.
View SolutionDraw average total cost, average variable cost and marginal cost curves in a single diagram. Also, explain the relationship between ATC and AVC.
View SolutionExplain the inverse relationship between price and quantity demanded of a commodity
View SolutionExplain the relationship between TC, TVC and TFC with the help of a hypothetical schedule and diagram.
View SolutionExplain the relationship between sanitation and disease.
View SolutionExplain the relationship between Total Product and Average Product.
View SolutionWhich diagram represents the relationship between Women, Mothers and Engineers ?

View SolutionWhich of the following Venn Diagram gives the relationship between Friend, Guide and Philosopher ?

View Solution
