Describe and illustrate important steps to be followed in preparing a Choropleth map.
Text Solution
The choropleth maps are drawn to prepare the characteristics of data as they are related to the administrative units. These means are used to represent the literacy rate, sex ratio and density of population.
Steps to be followed:
a. Arrange the data in ascending or descending order.
b. Group the data into 5 categories to represent very high, high, medium, low and very low concentrations.
c.The interval between the categories may be identified on the following formula, i.e. Range/5 and Rage = maximum value - maximum value.
d. Patterns, shades or colour to be used to depict the chosen categories should be marked in an increasing or decreasing order.


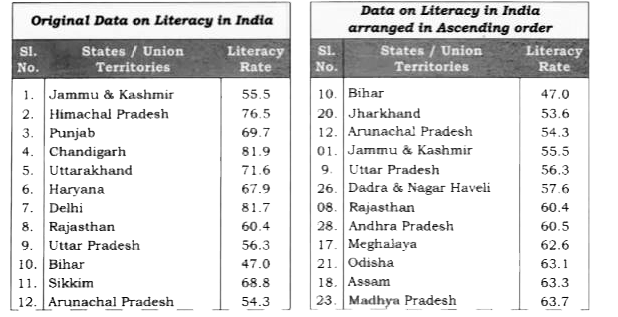
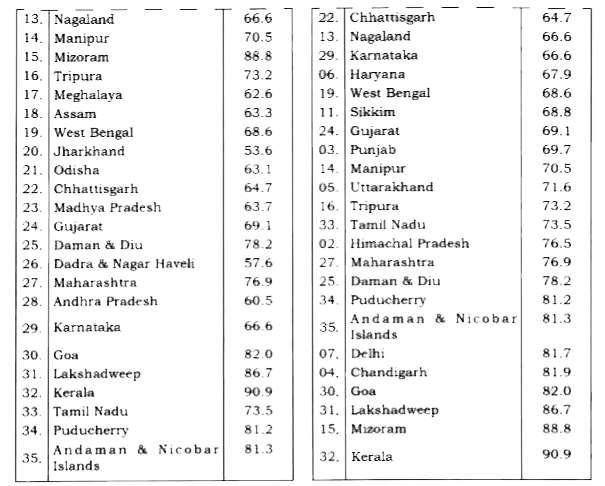
a. Arrange the data in ascending order as shown above.
b. Identify the range within the data. The states recording the lowest and highest literacy rates are Bihar (47%) adn the Kerala (90.9%) respectively. Hence the range would be 91.0-47.1=44.0.
c. Divide the range by 5 to get categories from very low to very high. (44.0/5=8.80. We can convert this value to a round number of 9.0.
Determinet the number of the categories along with range of each category. Add 9.0 to the lowest value of 47.0 as so on.
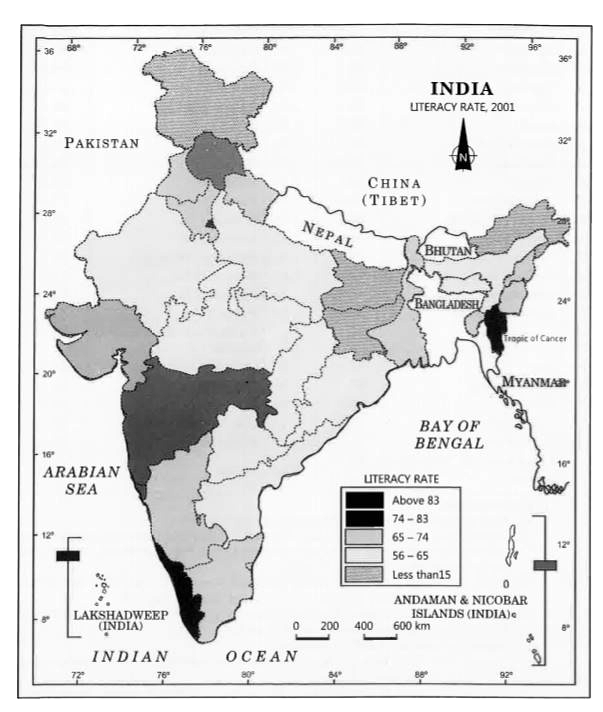
Following categories will be obtained.
(i) 47-56 Very low (Bihar, Jharkhand, Arunacal Pradesh, Jammu and Kashmir)
(ii) 56-65 Low (Uttar Pradesh, Rajasthan, Andhra Pradesh, Meghalaya, Odisha, Assam,Madhya Pradesh, Chhattisgarh)
(iii) 65-74 Medium(Nagaland, karnataka, Haryana, West Bengal, Sikkim, Gujarat, Punjab, Manipur, Uttarakhand, Tripura, Tamil Nadu)
(iv) 74-83 High (Himachal Pradesh, Maharashtra, Delhi, Goa)
(v) 83-92 Very High (Mizoram, Kerala)
e. Assign the shades/ pattern to each category ranging from lower to higher hues.

|
Topper's Solved these Questions
- GRAPHICAL REPRESENTATION OF DATABOOK - FULL MARKSCHAPTER - GRAPHICAL REPRESENTATION OF DATAEXERCISE - NCERT TEXTBOOK QUESTIONS SOLVED (ACTIVITY)
5 Videos
- GRAPHICAL REPRESENTATION OF DATABOOK - FULL MARKSCHAPTER - GRAPHICAL REPRESENTATION OF DATAEXERCISE - ADDITIONAL QUESTIONS SOLVED (VERY SHORT ANSWER QUESTIONS)
11 Videos
- DATA-ITS SOURCE AND COMPLIATIONBOOK - FULL MARKSCHAPTER - DATA-ITS SOURCE AND COMPLIATIONEXERCISE - ADDITIONAL QUESTION SOLVED (IV. VIVA-VOCE QUESTIONS)
8 Videos
- HUMAN DEVELOPMENTBOOK - FULL MARKSCHAPTER - HUMAN DEVELOPMENTEXERCISE - Worksheet (Based on Chapter -4)
12 Videos
Similar Questions
Knowledge Check
Important steps in decomposition are
AFragmentation and mineralisationBLeeching and catabolismCHumification and mineralisationDAll of the above
Describe and illustrate with an example, a detergent.
View SolutionDescribe and illustrate with an example, a detergent.
View SolutionDescribe the important steps in muscle contraction.
View SolutionDescribe the importance of the following: limestone.
View SolutionBegggars method and illustration OF important problems
View SolutionBegggars method and illustration OF important problems
View Solutionillustrations + important note on root at infinity
View Solution
