Carry out the following steps using the given data set.
a. Enter the given data in a file and store in My Documents folder (Name the file as rainfall).
b. Calculate the standard deviation and mean for the given data set using Function Wizard in Excel spreadsheet.
c. Compute coefficient of variation using the results derived in step. b.
d. Analyse the results.
Do Your self
Topper's Solved these Questions
- USE OF COMPUTER IN DATA PROCESSING AND MAPPINGBOOK - FULL MARKSCHAPTER - USE OF COMPUTER IN DATA PROCESSING AND MAPPINGEXERCISE - ADDITIONAL QUESTIONS SOLVED ( SHORT ANSWER QUESTIONS)
1 Videos
- USE OF COMPUTER IN DATA PROCESSING AND MAPPINGBOOK - FULL MARKSCHAPTER - USE OF COMPUTER IN DATA PROCESSING AND MAPPINGEXERCISE - ADDITIONAL QUESTIONS SOLVED (VERY SHORT ANSWER QUESTIONS)
12 Videos
- USE OF COMPUTER IN DATA PROCESSING AND MAPPINGBOOK - FULL MARKSCHAPTER - USE OF COMPUTER IN DATA PROCESSING AND MAPPINGEXERCISE - TEST ASSIGNMENT
5 Videos
- TRANSPORT AND COMMUNICATION BOOK - FULL MARKSCHAPTER - TRANSPORT AND COMMUNICATION EXERCISE - WORKSHEET
9 Videos
- WATER RESOURCESBOOK - FULL MARKSCHAPTER - WATER RESOURCESEXERCISE - WORKSHEET
9 Videos
Similar Questions
Knowledge Check
From the following flowsheet for the extraction of pure metal, answer the given questions.

(ii) Step B (reduction) can be carried out ny using :ACarbonBMore electropositive elementCBoth of theseDNone of theseArrange the following steps in proper sequence to determine the relative density of liquid by using a constant immersion hydrometer.
(a) The test tube is made to float in the given liquid.
(b) The weight of the test tube with lead shots in air is determined (W1).
( c) The depth of the test tube immersed in water (h) is determined.
(d) The test tube is made to float in water.
(e ) Lead shots are added or removed from the test tube such that the test tube is immersed to the same depth (h) in the given liquid.
(f) The relative density of the liquid is measured as W1W1.
(g) The test tube is taken out from the given liquid and its weight (W2) is measured.Ab d c a e g fBb d c a e f gCb g f e a c dDb a d c e f g
If standard deviation of a given data is 5 and mean is 50 then coefficient of variation (C.V) is equal to
A) 100
B) 0
C) 1
D) 10
View SolutionIf standard deviation of a given data is 5 and mean is 50 then coefficient of variation (C.V) is equal to a)100 b)0 c)1 d) 10
View SolutionFrom the following flowsheet for the extraction of pure metal, answer the given questions.

(ii) Step B (reduction) can be carried out ny using :
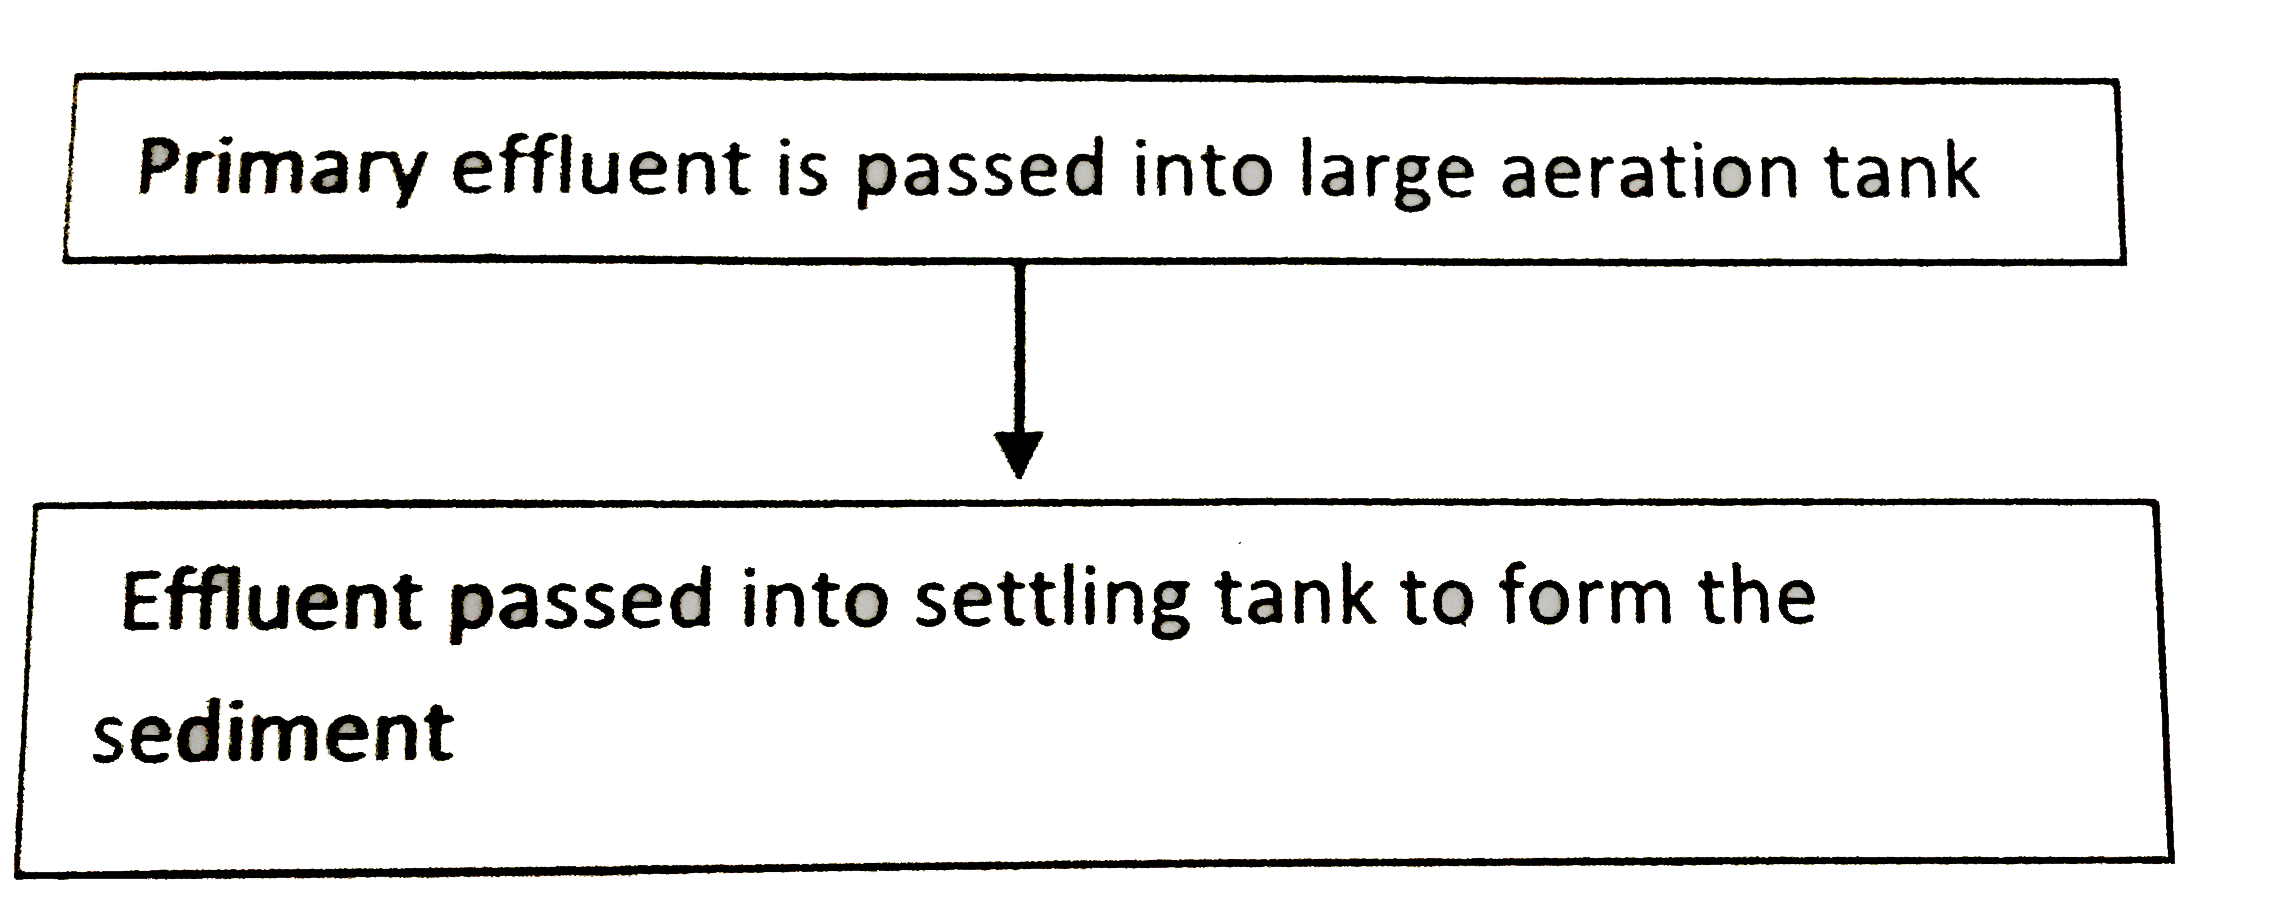
View SolutionLarge quantities of sewage is generated everyday in cities and towns, which is treated in Sewage Treatment Plants (STPs) to make it less polluted. Given below is the flow diagram of one of the stages of STP.
Observe the given flow diagram and answer the questions accordingly

(a) Why primary effluent is passed into large aeration tanks?
(b) Write the technical term used for the sediment formed? Mention its significance
(c) Explain the final step that results in the formation of biogas in the large tank before the treated effluent is released into water bodies.
View SolutionLarge quantities of sewage is generated everyday in cities and towns, which is treated in Sewage Treatment Plants (STPs) to make it less polluted. Given below is the flow diagram of one of the stages of STP.
Observe the given flow diagram and answer the questions accordingly

(a) Why primary effluent is passed into large aeration tanks?
(b) Write the technical term used for the sediment formed? Mention its significance
(c) Explain the final step that results in the formation of biogas in the large tank before the treated effluent is released into water bodies.
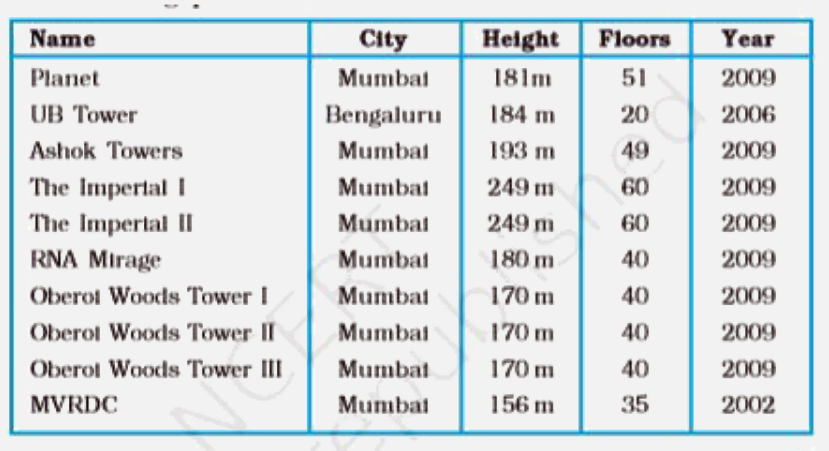
View SolutionBelow is a list of 10 tallest buildings in India.
This list ranks buildings in India that stand at least 150m (492 ft.) tall, based on standard height measurement. This includes spires and architectural details but does not include antenna marks. Following data is given as per the available information till 2009. Since new buildings are always under construction, go on-line to check new taller buildings.
Use the information given in the table about sky scrapers to answer the following questions:

(a) Find the height of each storey of the three tallest buildings and write them in the following table:

(b) The average height of one storey for the buildings given in (a) is
(c) Which city in this list has the largest percentage of skyscrappers? What is the percentage?
(d) What is the range of data?
(e) Find the median of the data.
(f) Draw a bar graph for given data.
View Solution


