Discus the use of graphs, diagrams and maps.
Step by step video & image solution for Discus the use of graphs, diagrams and maps. by Geography experts to help you in doubts & scoring excellent marks in Class 12 exams.
Updated on:21/07/2023Topper's Solved these Questions
- USE OF COMPUTER IN DATA PROCESSING AND MAPPINGBOOK - FULL MARKSCHAPTER - USE OF COMPUTER IN DATA PROCESSING AND MAPPINGEXERCISE - ADDITIONAL QUESTIONS SOLVED (VIVA VOCE QUESTIONS)
6 Videos
- TRANSPORT AND COMMUNICATION BOOK - FULL MARKSCHAPTER - TRANSPORT AND COMMUNICATION EXERCISE - WORKSHEET
9 Videos
- WATER RESOURCESBOOK - FULL MARKSCHAPTER - WATER RESOURCESEXERCISE - WORKSHEET
9 Videos
Similar Questions
Knowledge Check
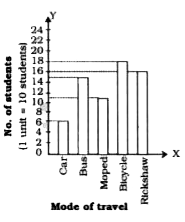
The following bar diagram, represents the use of different modes of travel to school by students in a certain locality of the town. Study the graph and answer the questions.

What is the ratio of the students using their means of transport as Car with those using Rickshaw ?A7:2B8:3C2:7D3:8
1.Name the most commonly used graphs and maps.
View SolutionWhat is a map?
View SolutionDiscus the real motivating factors behind the voyages of discovery.
View SolutionDiscuss how weather maps and charts are prepared and how they are useful to us.
View SolutionStudy the table give below and draw the given diagrams/ maps.
Area and Production of Rice in Major States.

a. Construct a multiple bar diagram to show area under rice in each state.
b. Construct a pie diagram to show the percentage of area under rice in each state.
c. Construct a dot map to show the production of rice in each state.
d. Construct a Choropleth map to show the percentage of production of rice in states.
View SolutionDiscues with examples, the distinctive features of Mughal chronicles.
View SolutionGeneral Rules For Constructing Diagrams And Graphs
View Solution
