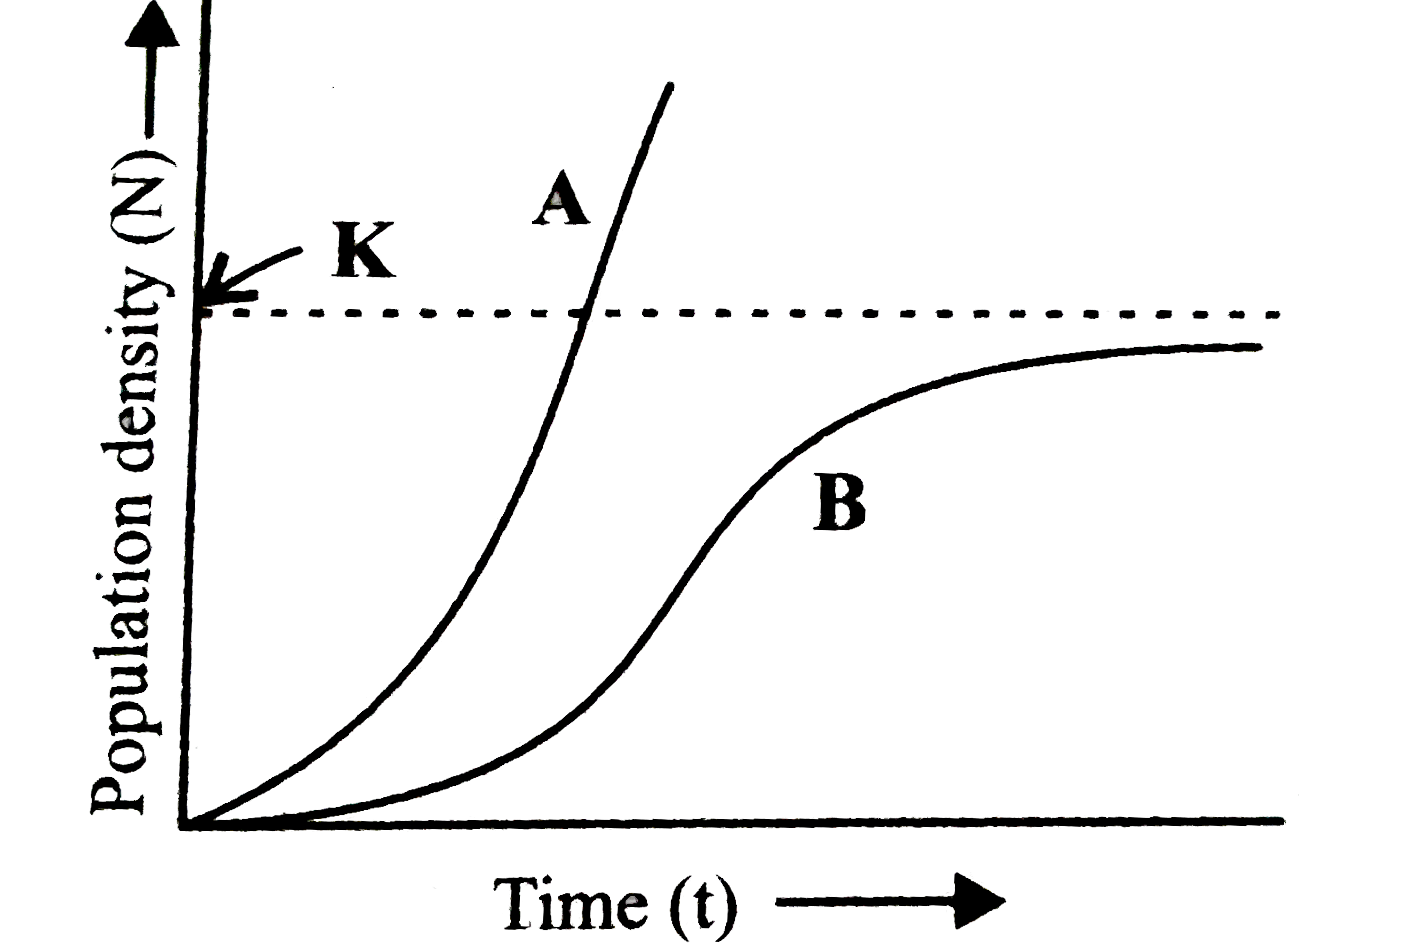
Draw population growth curves and explain them .
Step by step video & image solution for Draw population growth curves and explain them . by Biology experts to help you in doubts & scoring excellent marks in Class 12 exams.
Updated on:21/07/2023Topper's Solved these Questions
- ORGANISMS AND POPULATIONS Book:PRADEEPChapter:ORGANISMS AND POPULATIONS Exercise:Analytical (Questions with Answers)
Explore 20 Videos
- ORGANISMS AND POPULATIONS Book:PRADEEPChapter:ORGANISMS AND POPULATIONS Exercise:Practice Questions (I. Multiple Choice Questions)
Explore 87 Videos
- ORGANISMS AND POPULATIONS Book:PRADEEPChapter:ORGANISMS AND POPULATIONS Exercise:Short Answer Questions
Explore 112 Videos
- ORGANISMS AND POPULATIONORGANISMS AND POPULATIONSBook:PRADEEPChapter:ORGANISMS AND POPULATIONORGANISMS AND POPULATIONSExercise:Additional Questions (Very Short Answer Questions)
Explore 1 Video
- PRINCIPLES OF INHERITANCE AND VARIATION Book:PRADEEPChapter:PRINCIPLES OF INHERITANCE AND VARIATION Exercise:ASSERTION-REASON TYPE QUESTIONS
Explore 15 Videos
Similar Questions
Draw circuit diagram for n-p-n transistor to draw input and output characteristics in common base configuration. Draw the input and ouput curves and explain them.
View SolutionWhen does positive population growth takes place? Explain the geographical factors that influences the distribution of population in the world.
View Solution
Knowledge Check
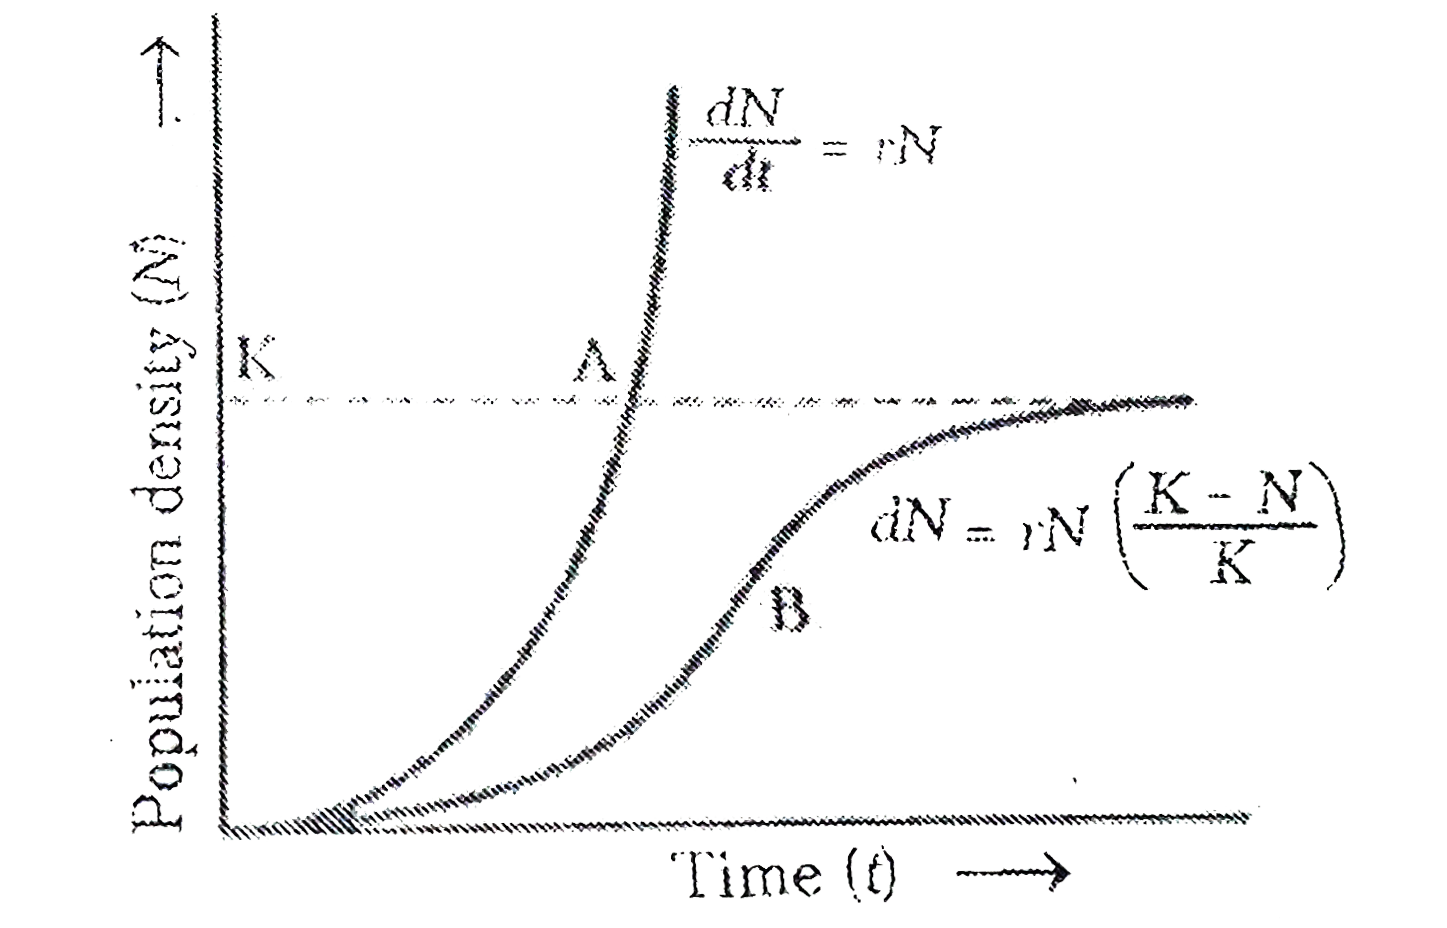
Study the population growth curves (A and B) in the given graph and select the incorrect option.
 ACurve 'A' shows exponential growth, represented by equation dNdt=rN.BCurve 'B' shows logistic growth, represented by equation dNdt=rN(K−NK)CExponential growth curve is considered as more realistic than the logistic growth curve.DCurve 'A' can also be represented by equation Nt=N0ert.
Human population growth is:
AlagBstationaryCexponentialDnone of these
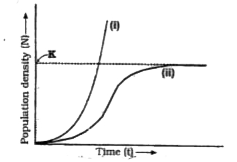
Study the population growth curves shown in the above diagram.
Which options is the best for curve (i) and (ii).AType of (i) curveType of (ii) curveStatus of food & sapcefor curve (i)Status & space for curve (ii)Equation for curve (ii)Equation for curve (i)Logistic curveExponential curve Unlimited LimiteddNdt=rNdNdt=rN(K−NK)BType of (i) curveType of (ii) curveStatus of food & sapcefor curve (i)Status & space for curve (ii)Equation for curve (ii)Equation for curve (i)Exponential curveLogistic curve Unlimited LimiteddNdt=rN(K−NK)dNdt=rNCType of (i) curveType of (ii) curveStatus of food & sapcefor curve (i)Status & space for curve (ii)Equation for curve (ii)Equation for curve (i)Logistic curveExponential curve Limited UnlimiteddNdt=rN(K−NK)dNdt=rNDType of (i) curveType of (ii) curveStatus of food & sapcefor curve (i)Status & space for curve (ii)Equation for curve (ii)Equation for curve (i)Exponential curveLogistic curve Limited UnlimiteddNdt=rNdNdt=rN(K−NK)
Distinguish between population growth and population change.
View SolutionDistinguish between population growth and population change.
View SolutionThe graph shows two types of population growth curve A is exponential and B is logistic.

Which one of the following growth model considered as more realistic one?
View SolutionHuman population growth in India.
View SolutionIn the logistic population growth curve shown below, the rate of growth is greatest at which point?

View Solution