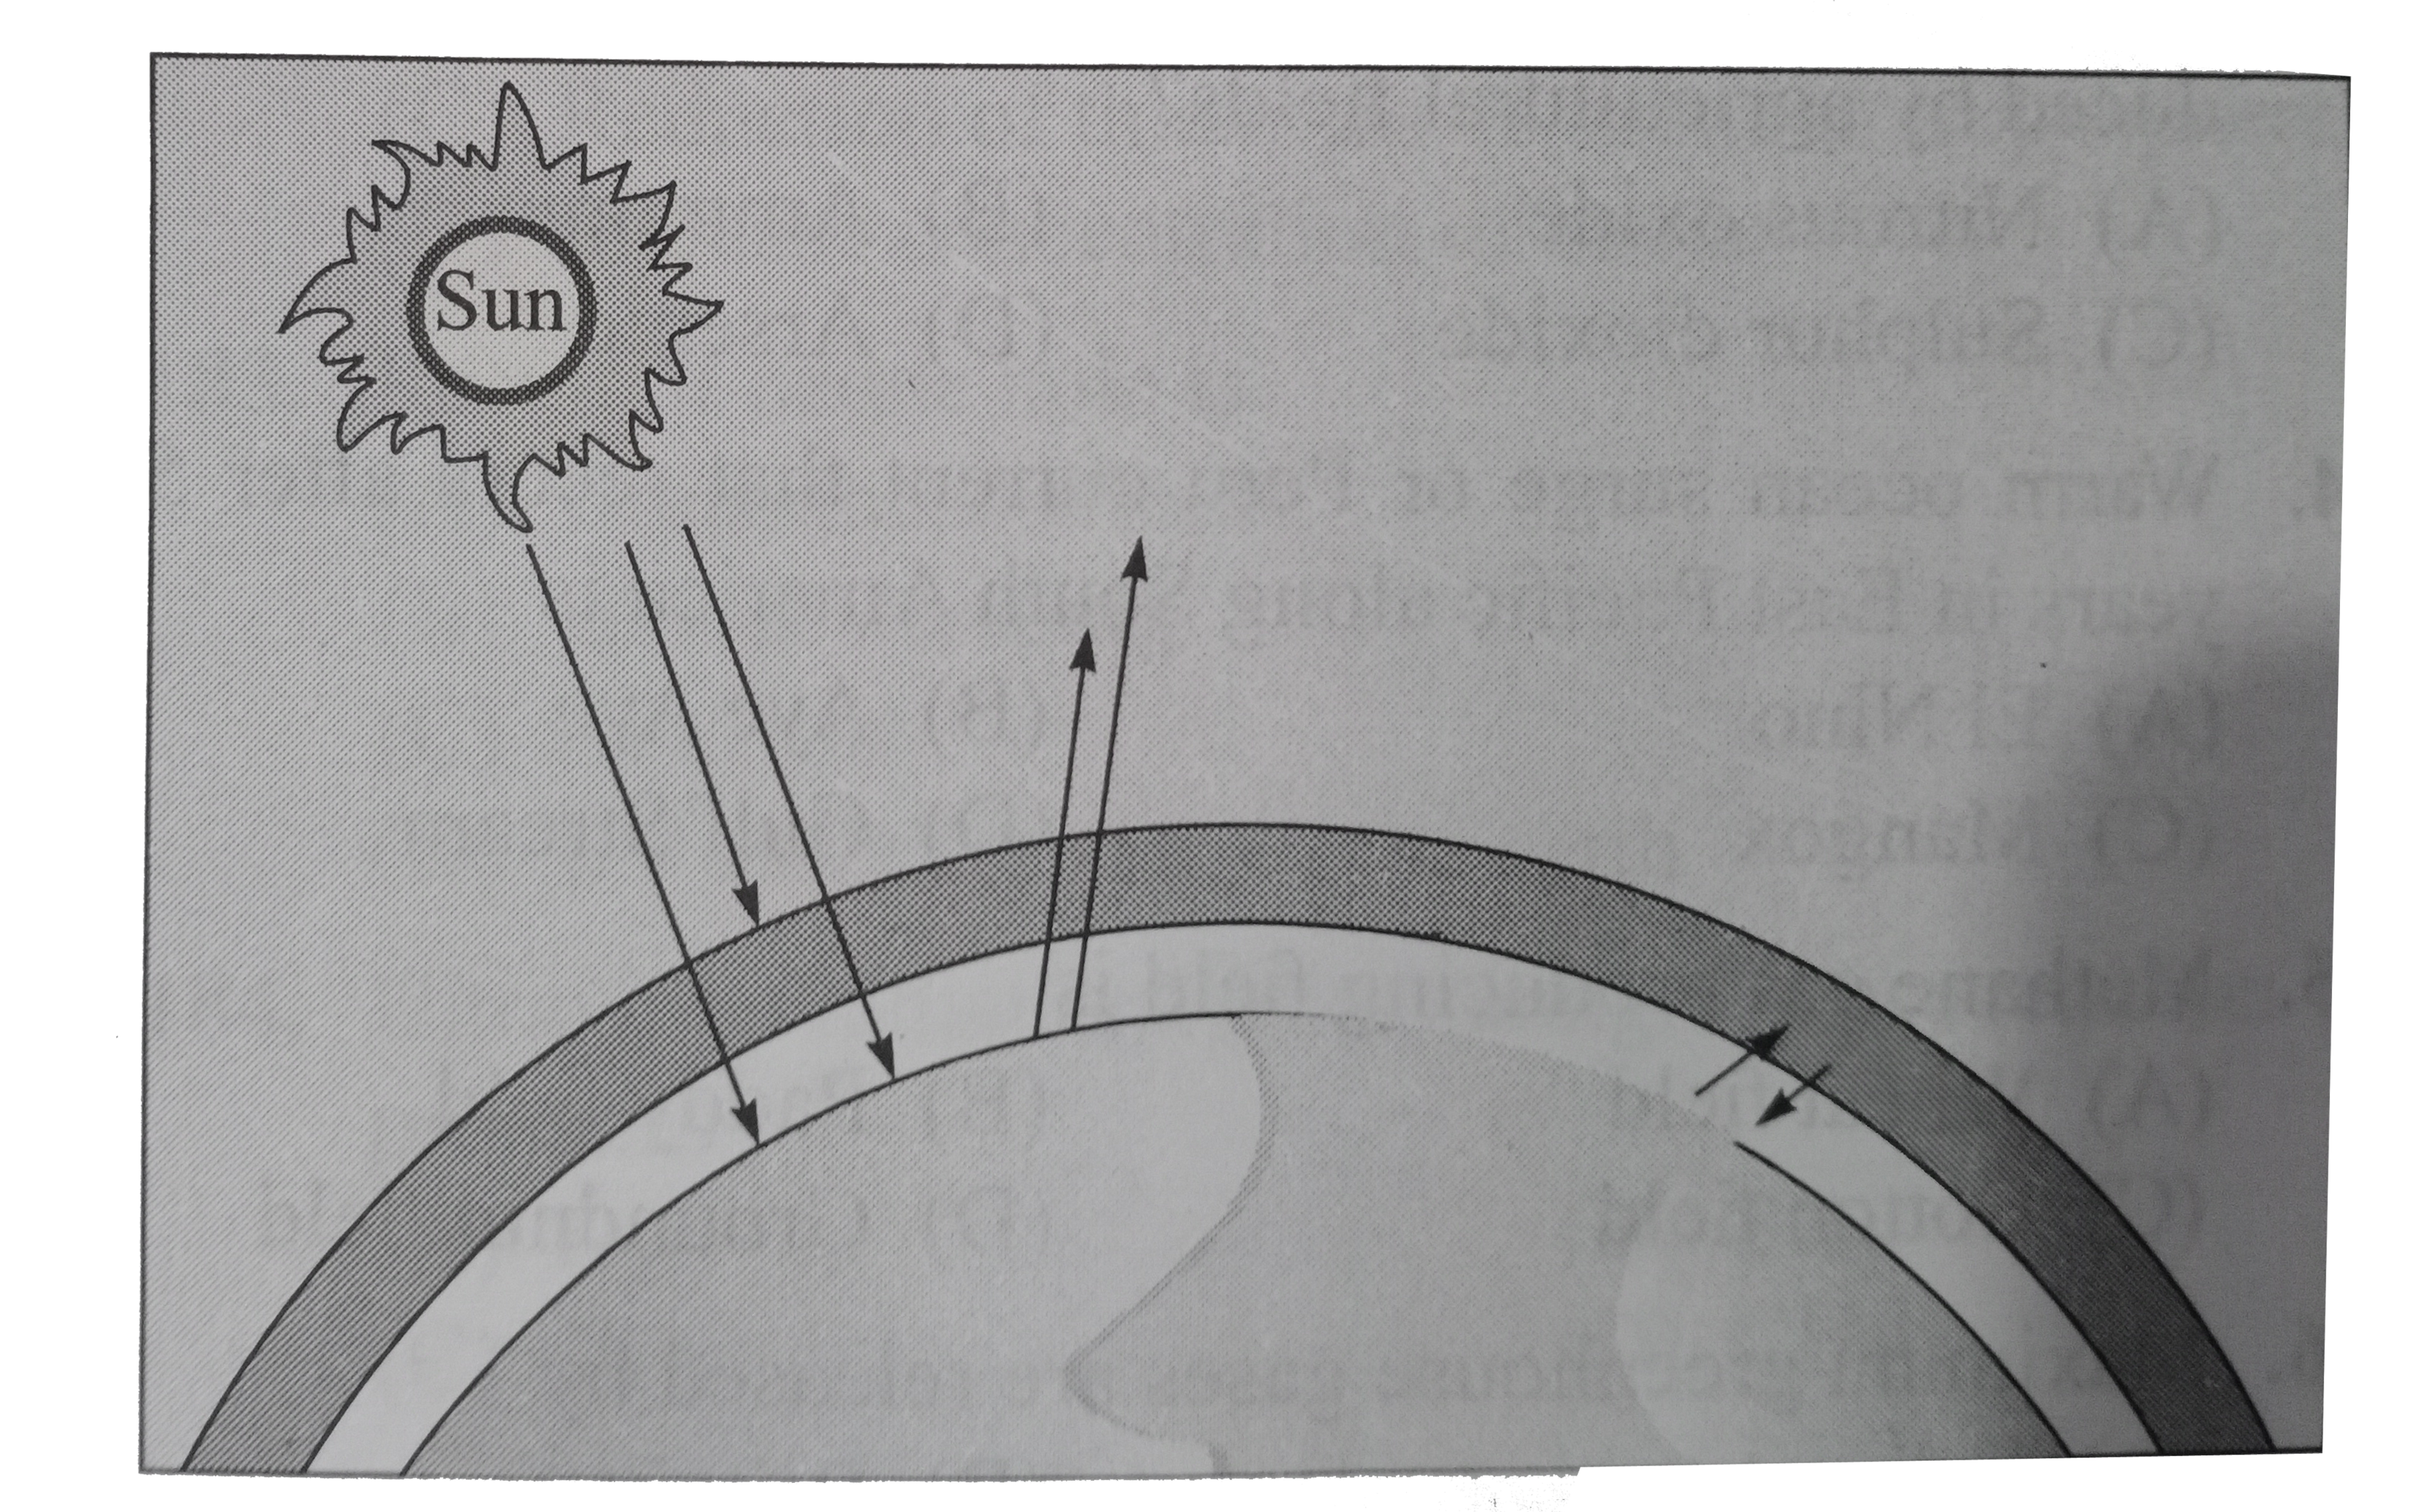
The following figure shows the phenomenon of
A
Greenhouse effect
B
Ozone layer depletion .
C
Deforestation
D
Eutrophication
Video Solution
Text Solution
The correct Answer is:A
|
Answer
Step by step video & image solution for The following figure shows the phenomenon of by Biology experts to help you in doubts & scoring excellent marks in Class 12 exams.
Updated on:21/07/2023Topper's Solved these Questions
- ENVIRONMENTAL ISSUESBOOK - A2ZCHAPTER - ENVIRONMENTAL ISSUESEXERCISE - Section A: Topicwise Questions (topic 5: Ozone Depletion In The Stratosphere)
23 Videos
- ENVIRONMENTAL ISSUESBOOK - A2ZCHAPTER - ENVIRONMENTAL ISSUESEXERCISE - Section A: Topicwise Questions (topic 6: Degration By Improper Resource Utilisation And Maintenance,
22 Videos
- ENVIRONMENTAL ISSUESBOOK - A2ZCHAPTER - ENVIRONMENTAL ISSUESEXERCISE - Section A: Topicwise Questions (topic 3: Solid, Wastes, Agro-chemicals And Their Effects, Radioactiv
23 Videos
- ECOSYSTEMBOOK - A2ZCHAPTER - ECOSYSTEMEXERCISE - Section-d Chapter-end Test
50 Videos
- EVOLUTIONBOOK - A2ZCHAPTER - EVOLUTIONEXERCISE - Section D : Chapter-end Test
50 Videos
Similar Questions
Knowledge Check
Which of the following defines the phenomenon of dedifferentiation ?
ALossing the capacity of divisionBLossing the capacity of division after regaining the sameCRegaining the capacity of divisionDAll of theseWhich of the following figures show(s) the bonding in diborane ?
A B
B CBoth (1) and (2)DNone of the above
Which of the following figures shows the stages of development of the bean plant in correct order ?
A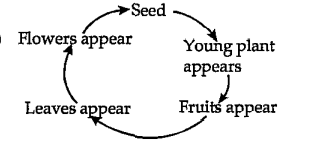 B
B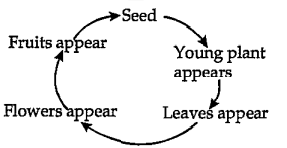 C
C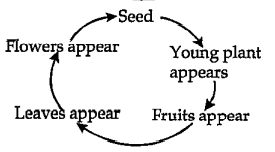 D
D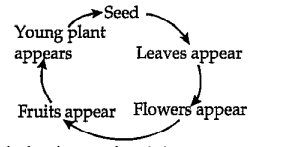
The following figure shows the process of
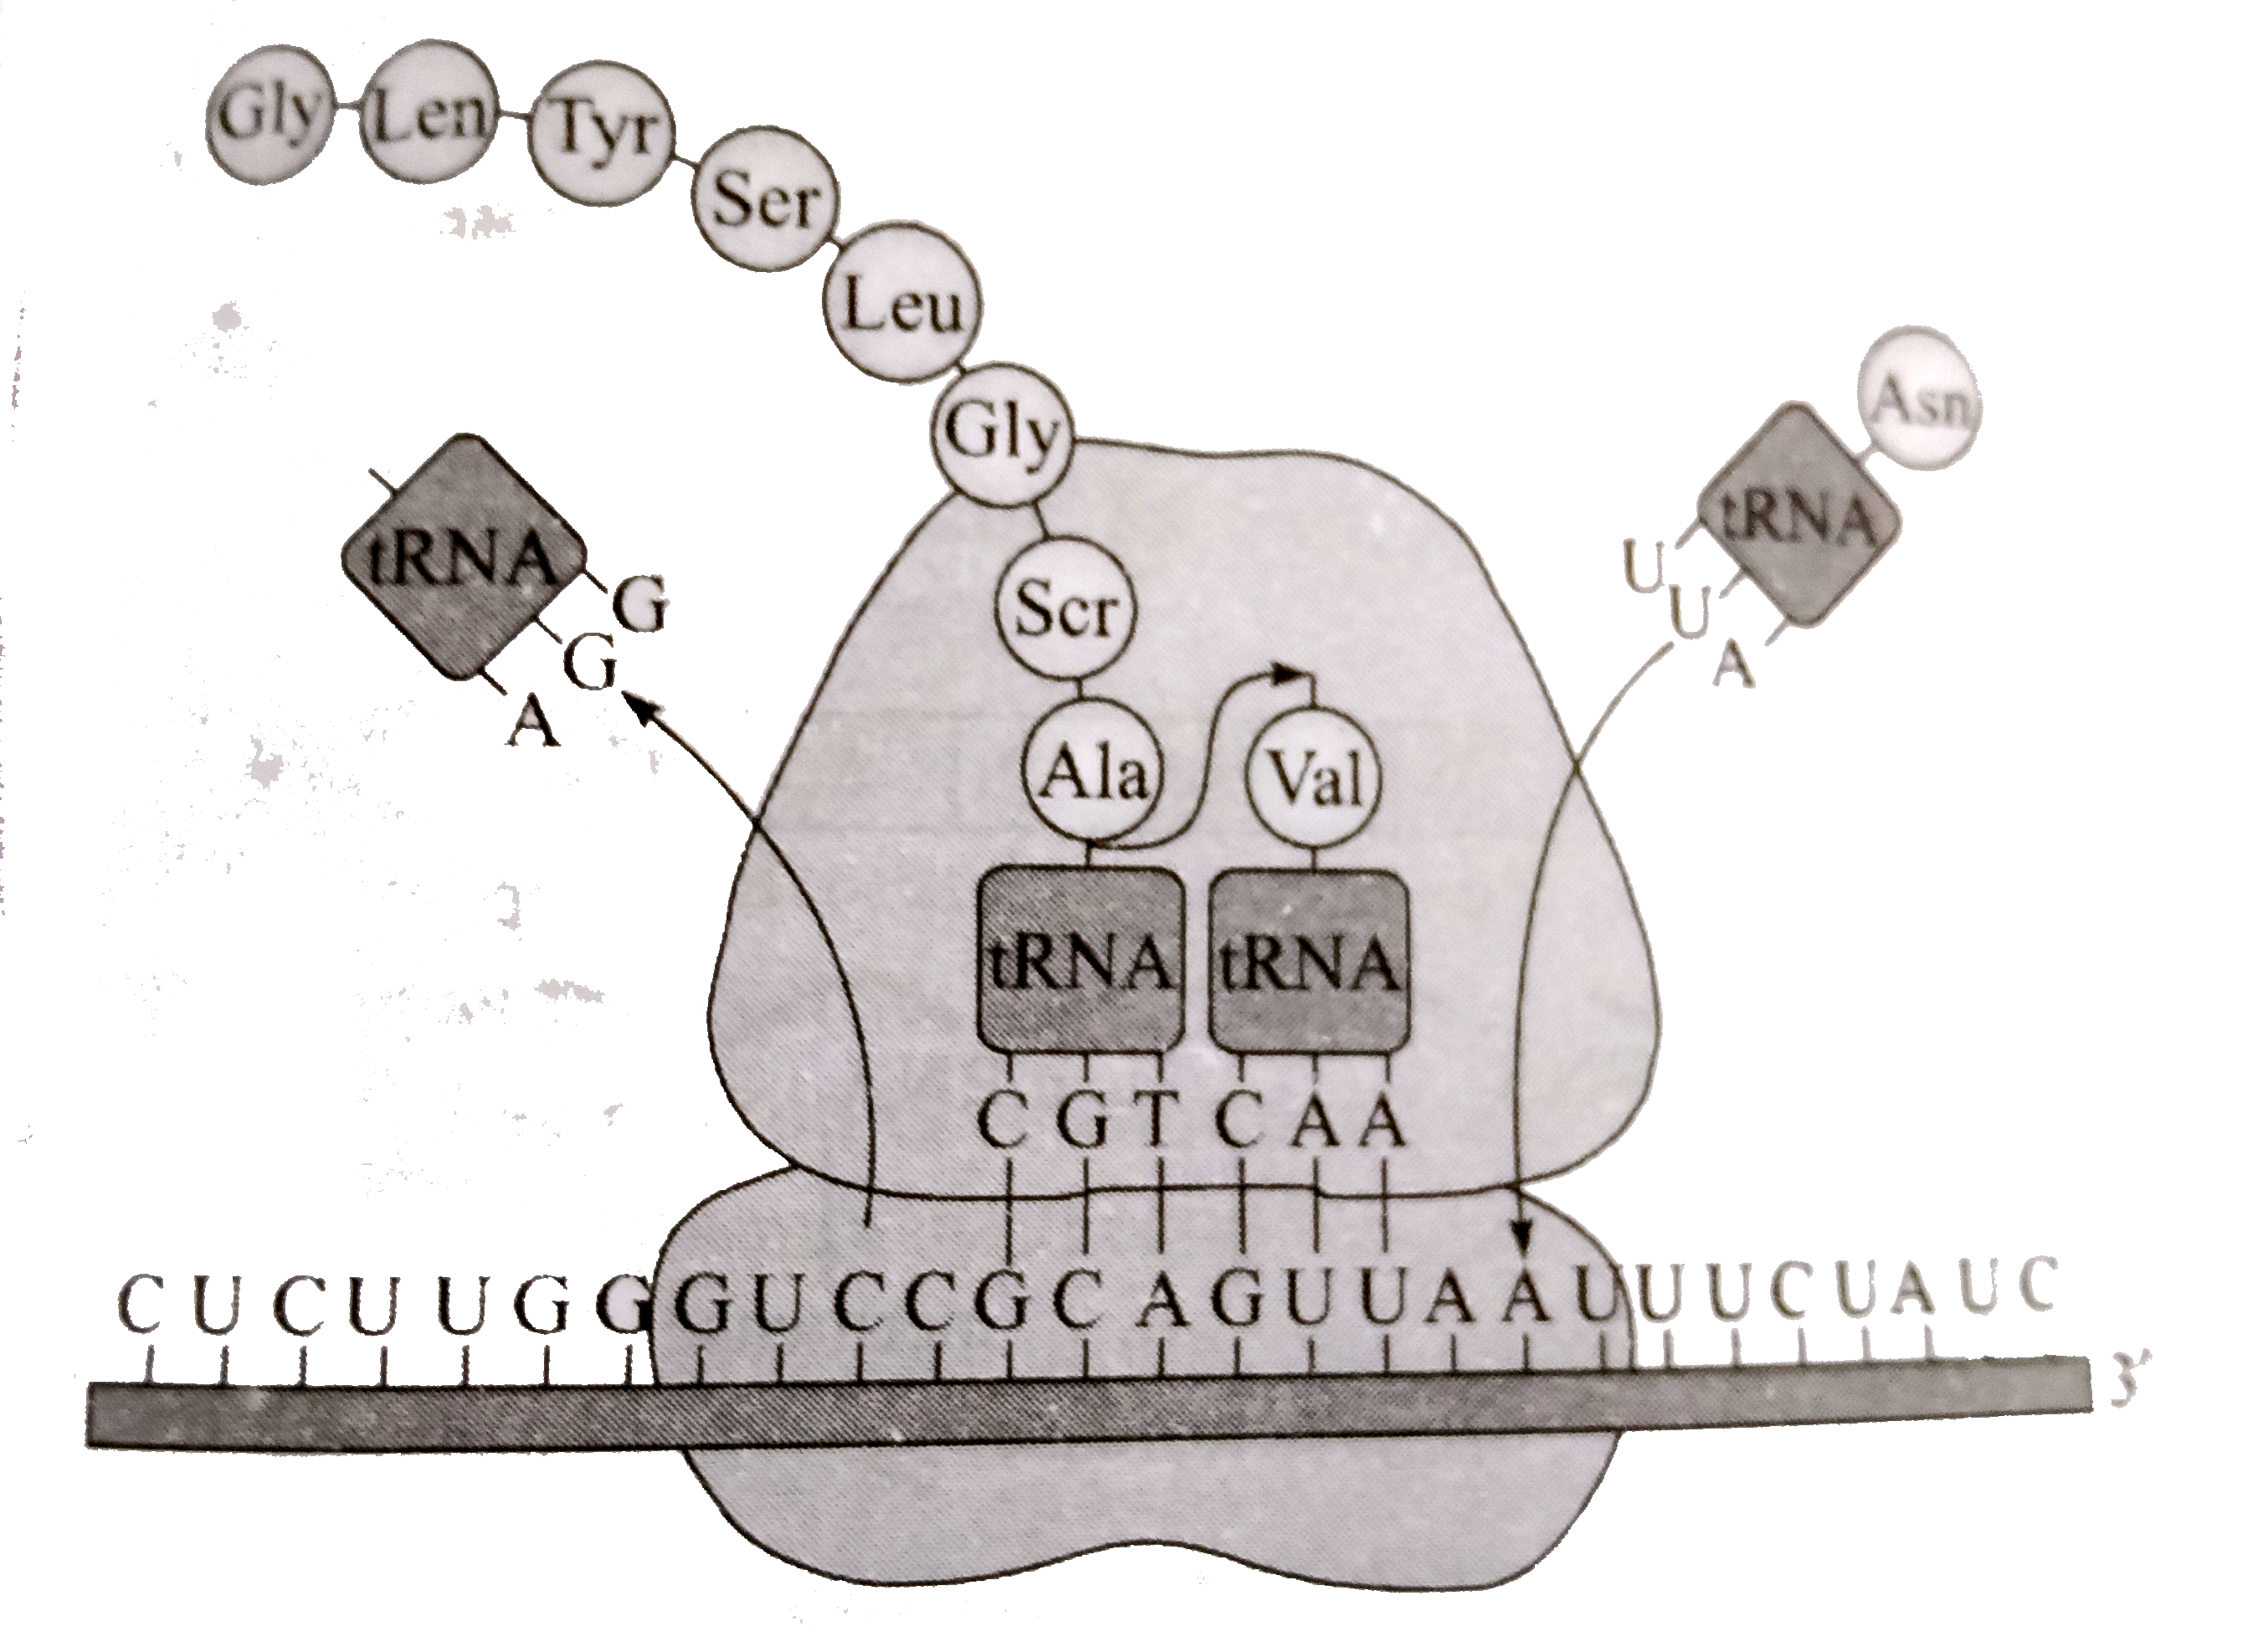
View SolutionWhich of the following figure shows the mandibles of cockroach ?
View SolutionWhich of the following figures shows the mandibles of cockroach ?
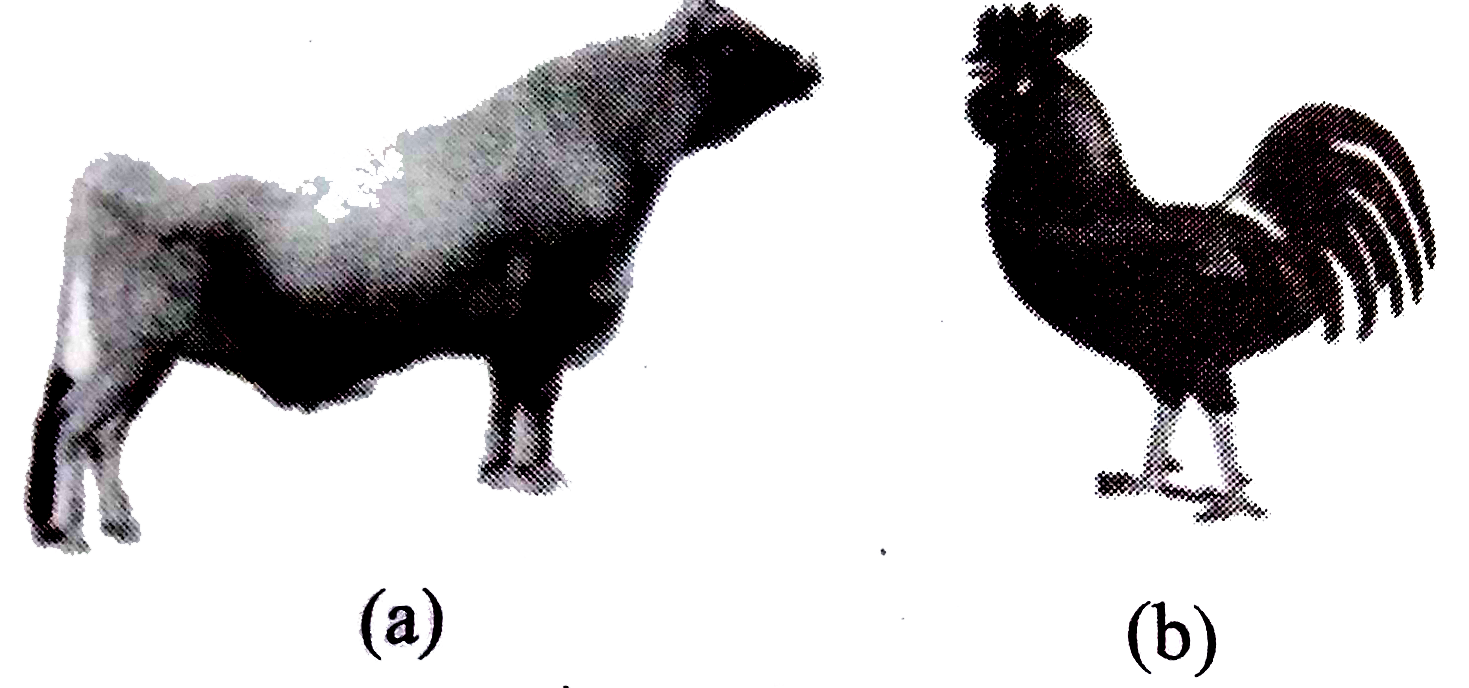
View SolutionThe following figure shows the improved breed of cattle and chickens where
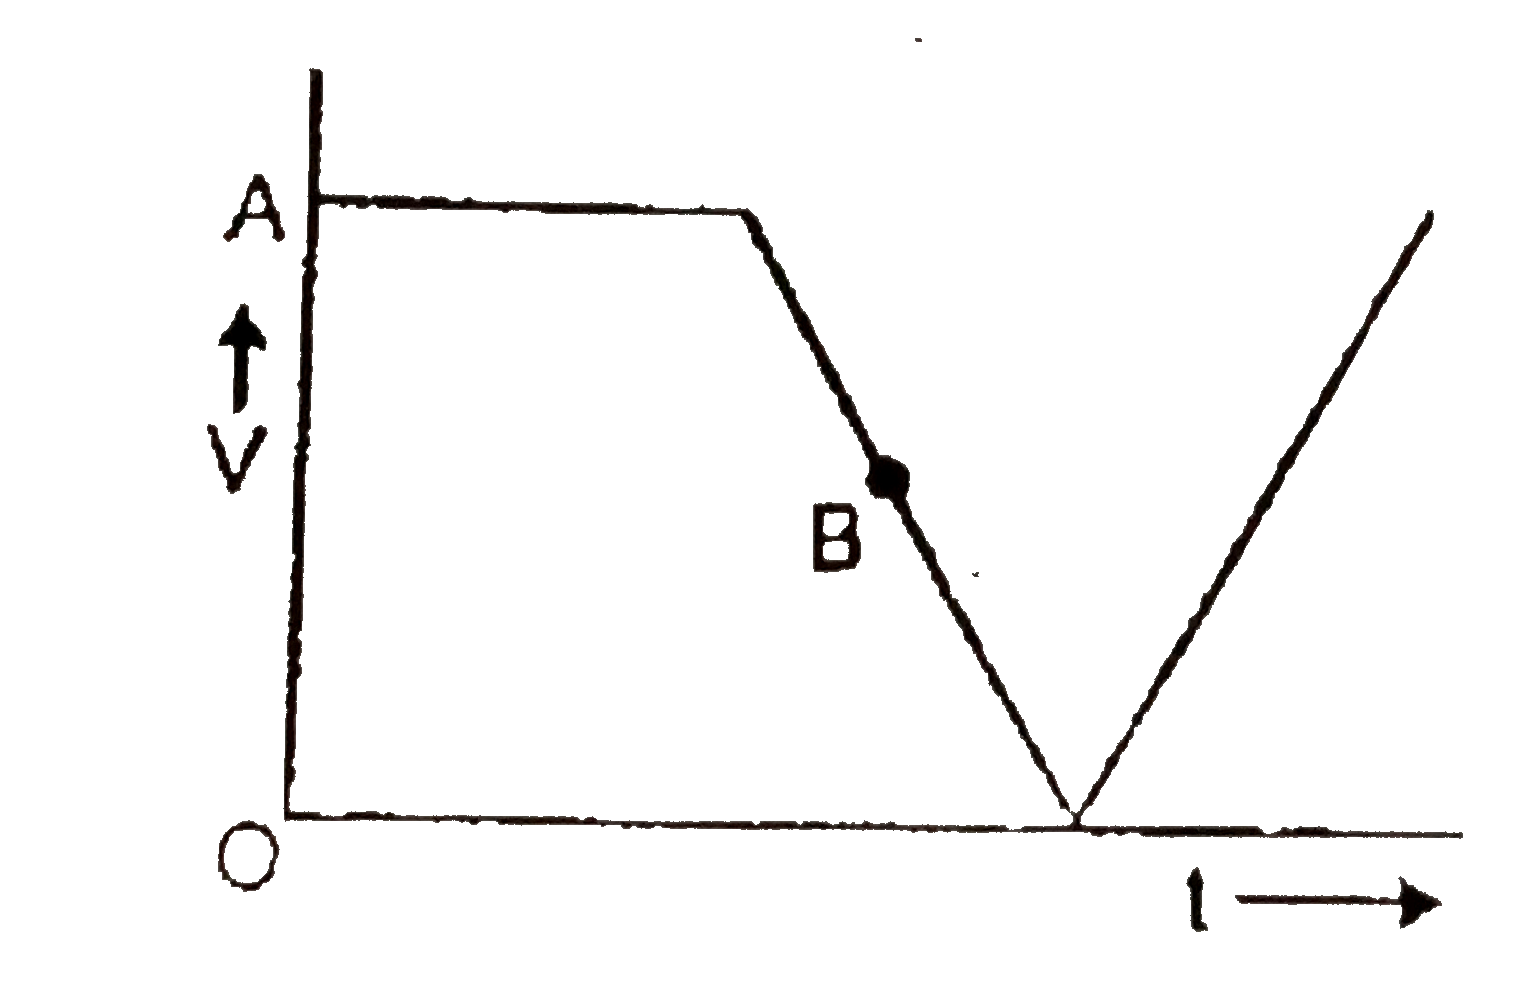
View SolutionThe following figure shows the velocity time graph of a body. According to this at the point B-
View Solution
