A train whistling at constant frequency is moving towards a station at a constant speed V. The train goes past a stationary observer on the station. The frequency n′ of the sound as heard by the observer is plotted as a function of time t, figure. Identify the expected curve.
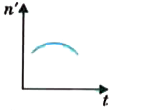
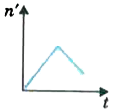
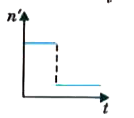
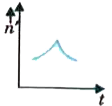
The correct Answer is:C
When train is approaching a stationary observer, the apparent frequency observed is given by
n'=υ−υ0υ−υsn=(υυ−V)n = constant
Also, n'>n
After crossing the stationary observer, the apparent frequency heard by observer is given by
n'=υ−υ0υ−υsn=(υυ+V)n = constant
Here n'<n
The correct option is (c).
Topper's Solved these Questions
- BOOK - MODERN PUBLICATIONCHAPTER - WAVESEXERCISE - HIGH ORDER THINKING SKILLS & ADVANCED LEVEL15videos
WAVES
- BOOK - MODERN PUBLICATIONCHAPTER - WAVESEXERCISE - REVISION EXERCISES107videos
WAVES
- BOOK - MODERN PUBLICATIONCHAPTER - WAVESEXERCISE - NCERT ADDITIONAL EXERCISES6videos
WAVES
- BOOK - MODERN PUBLICATIONCHAPTER - UNITS AND MEASUREMENTEXERCISE - CHAPTER PRACTICE TEST15videos
UNITS AND MEASUREMENT
- BOOK - MODERN PUBLICATIONCHAPTER - WORK, ENERGY AND POWER EXERCISE - Chapter Practice Test16videos
WORK, ENERGY AND POWER
Similar Questions
A sound source, emitting sound of constant frequency, moves with a constant speed and crosses a stationary observer. The frequency (n) of sound heard by the observer is plotted against time (t). Which of the following graphs represents the correct variation :-
View SolutionAn engine whistling at a constant frequency n0 and moving with a constant velocity goes past a stationary observer. As the engine crosses him, the frequency of the sound heard by him changes by a factor f. The actual difference in the frequencies of the sound heard by him before and after the engine crosses him is
View Solution
Knowledge Check
- Question 1 - Select One
A train whistling at constant frequency is moving towards a station at a constant speed v. The train goes past a stationary observer on the station. The frequency v of the sound as heard by the observer is plotted as a function of time t. Identify the expected curve.
A B
B C
C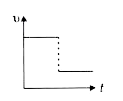 D
D
- Question 2 - Select One
A railway engine whistling at a constant frequency moves with a constant speed. It goes past a stationary observer standing beside the railway track. The frequency (n) of the sound heard by the observer is plotted agains time (t). Which of the following best represents the resulting curve?
A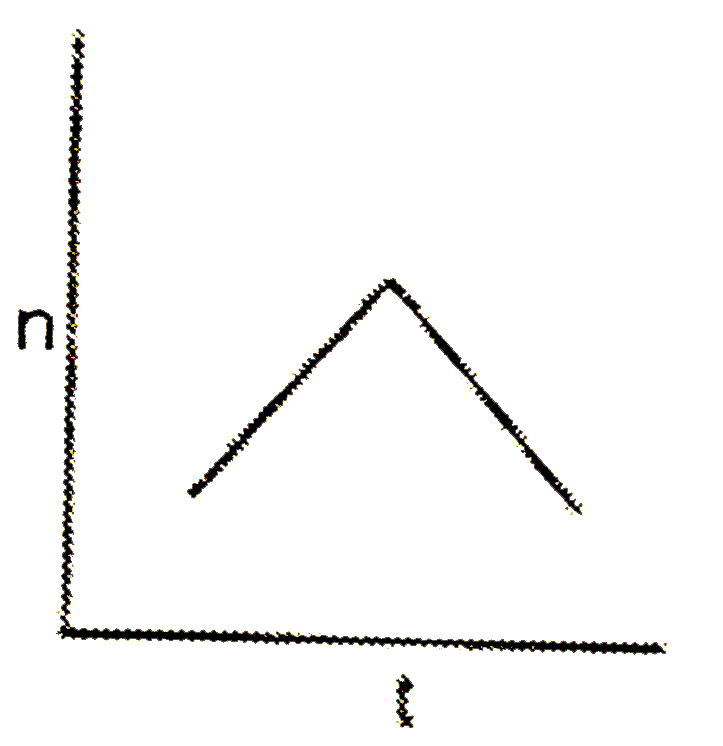 B
B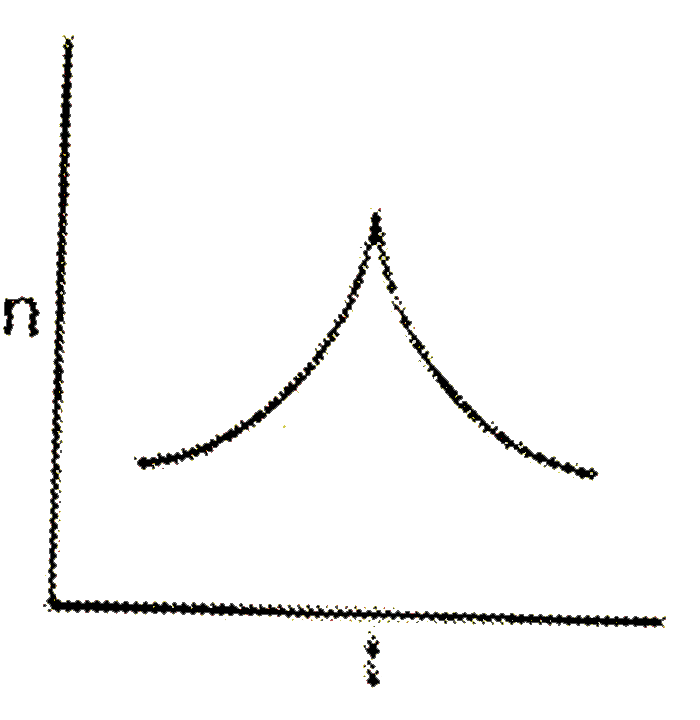 C
C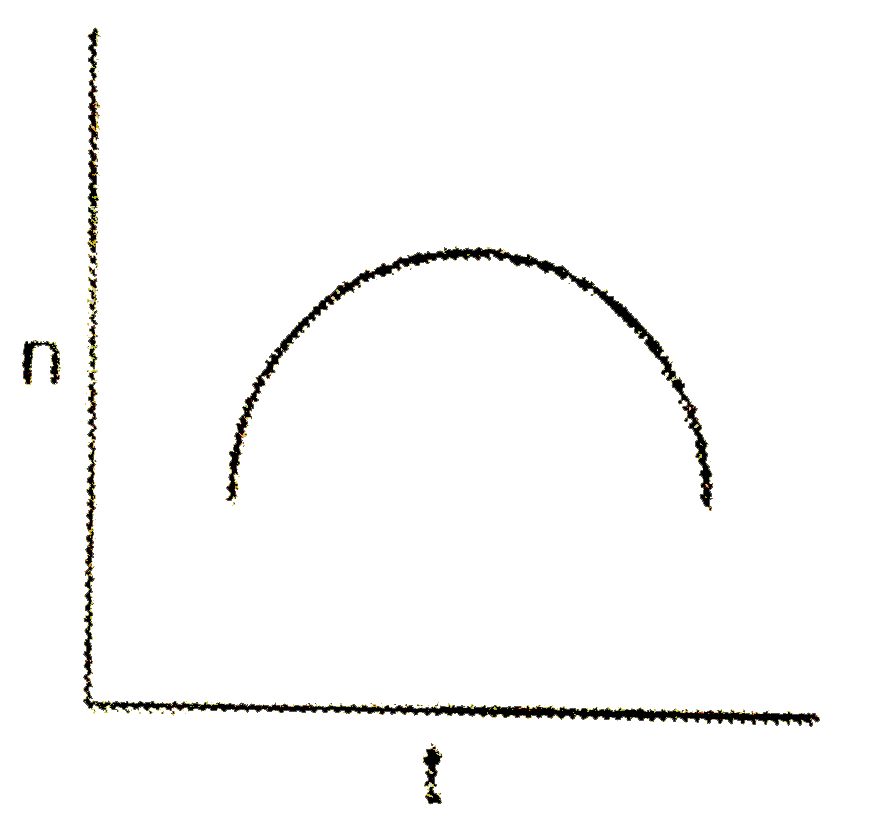 D
D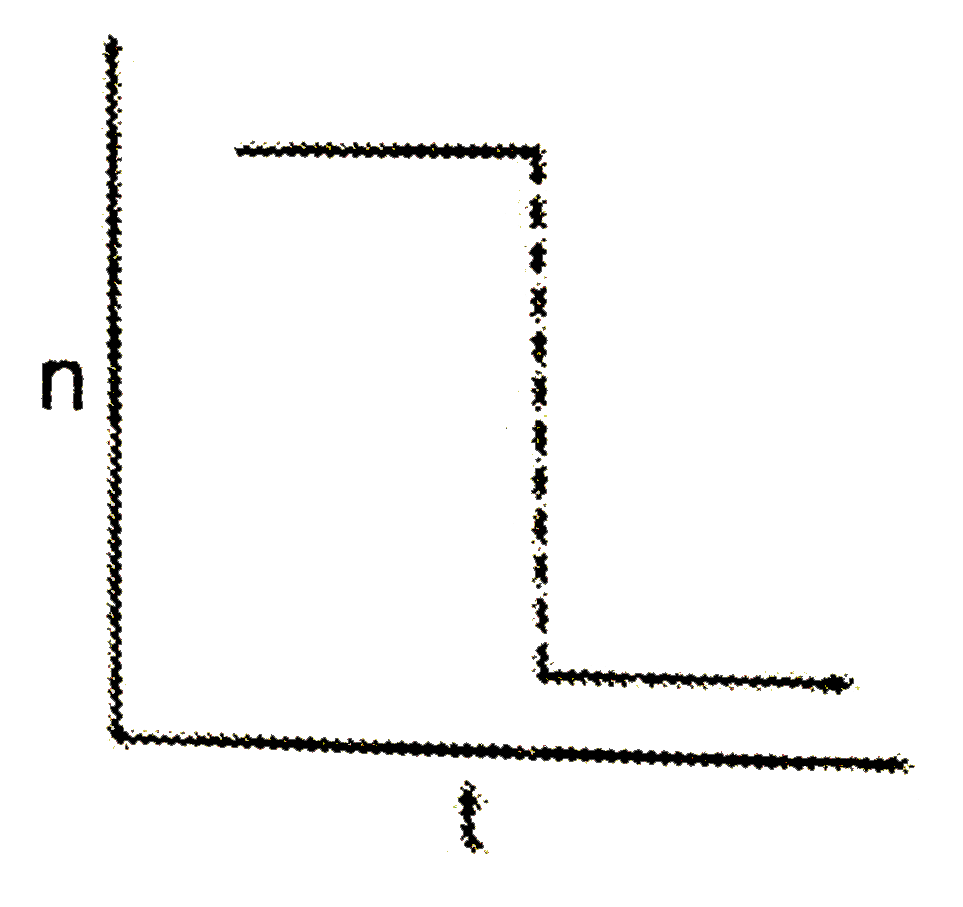
- Question 3 - Select One
A sound source, emitting sound of constant frequency, moves with a constant speed and crosses a stationary observer. The frequency (n) of sound heard by the observer is plotted against time (t). Which of the following graphs represents the correct variation :-
A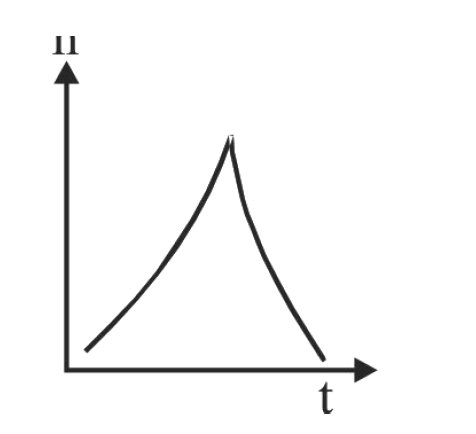 B
B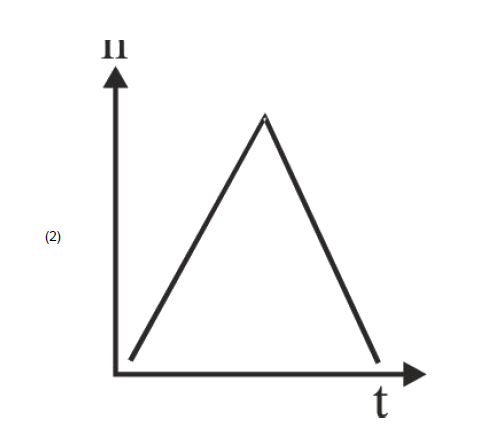 C
C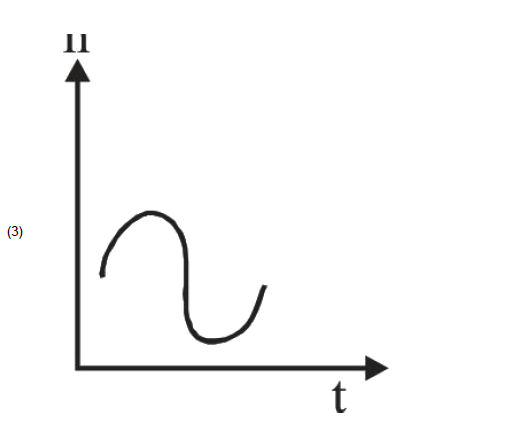 D
D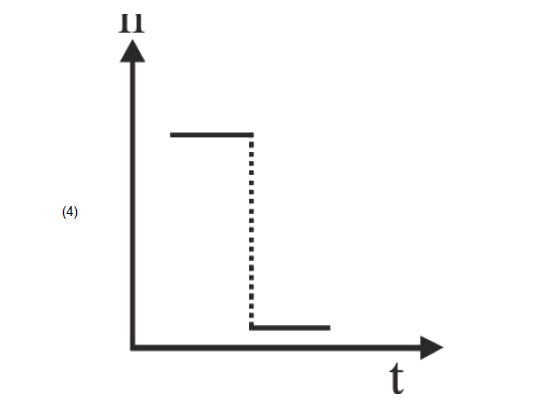
An engine whistling at a constant frequency n0 and moving with a constant velocity goes past a stationery observer. As the engine crosses him, the frequency of the sound heard by him changes by a factor f. The actual difference in the frequencies of the sound heard by him before and after the engine crosses him is
View SolutionA train is moving towards a stationary observer. Which of the following curve best represents the frequency recived by observer f aas afunction of time?
View SolutionA source of sound is travelling towards a stationary observer. The frequency of sound heard by the observer is 25% more than the actual frequency. If the speed of sound is v, that of the source is
View SolutionIf a source of frequency n moving with velocity v crosses a stationary observer, then the change in the frequency of sound heard by the observer will be (velocity of sound = V)
View Solutiona bus is moving towards and stationary observer with speed 20 m/s blows a horn of frequency 200 Hz. the frequency of sound heard by the observer is approximately ( take speed of sound 320 m/s)
View Solution

