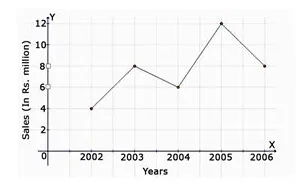
The line graph shows the yearly sales figure for a manufacturing company. From the graph, what were the sales in 2004?

Rs 5 million
Rs 6 million
Rs 7 million
Rs 8 million
The correct Answer is:B
Similar Questions
The inequation that best describes the following graph is _________
View SolutionThe equation of straight line shown in figure is :
ltimg src="https://d10lpgp6xz60nq.cloudfront.net/physics_images/ALN_PHY_R04_E01_020_Q01.png" width="80%"gt
View SolutionFrom the following figure, the correct observation is :- ltimg src="https://d10lpgp6xz60nq.cloudfront.net/physics_images/ALN_PHY_R03_E08_015_Q01.png" width="80%"gt
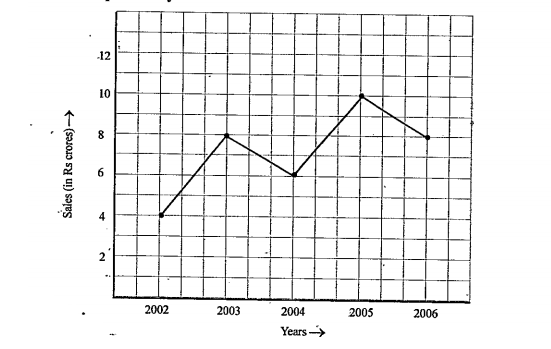
View SolutionThe following line graph shows the yearly sales figures for a manufacturing company.
What were the sales in (i) 2002 (ii) 2006 ?

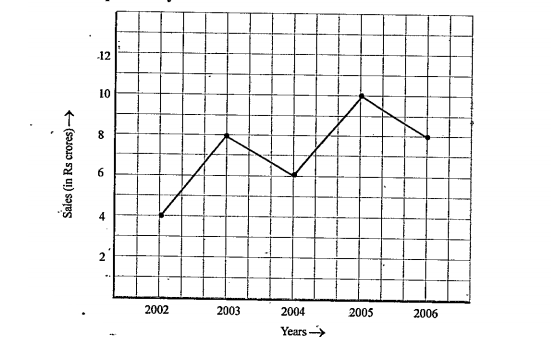
View SolutionThe following line graph shows the yearly sales figures for a manufacturing company.
What were the sales in (i) 2003 (ii) 2005?

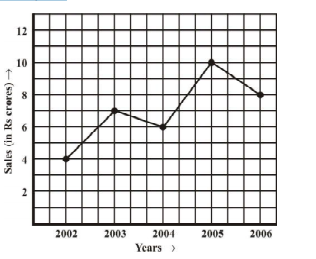
View SolutionThe following line graph shows the yearly sales figures for a manufacturing company: What were the sales in (i) 2003 (ii) 2005?

View SolutionThe equation of straight line shown in figure is :
ltimg src="https://d10lpgp6xz60nq.cloudfront.net/physics_images/ALN_PHY_R04_E01_020_Q01.png" width="80%"gt
View Solution
