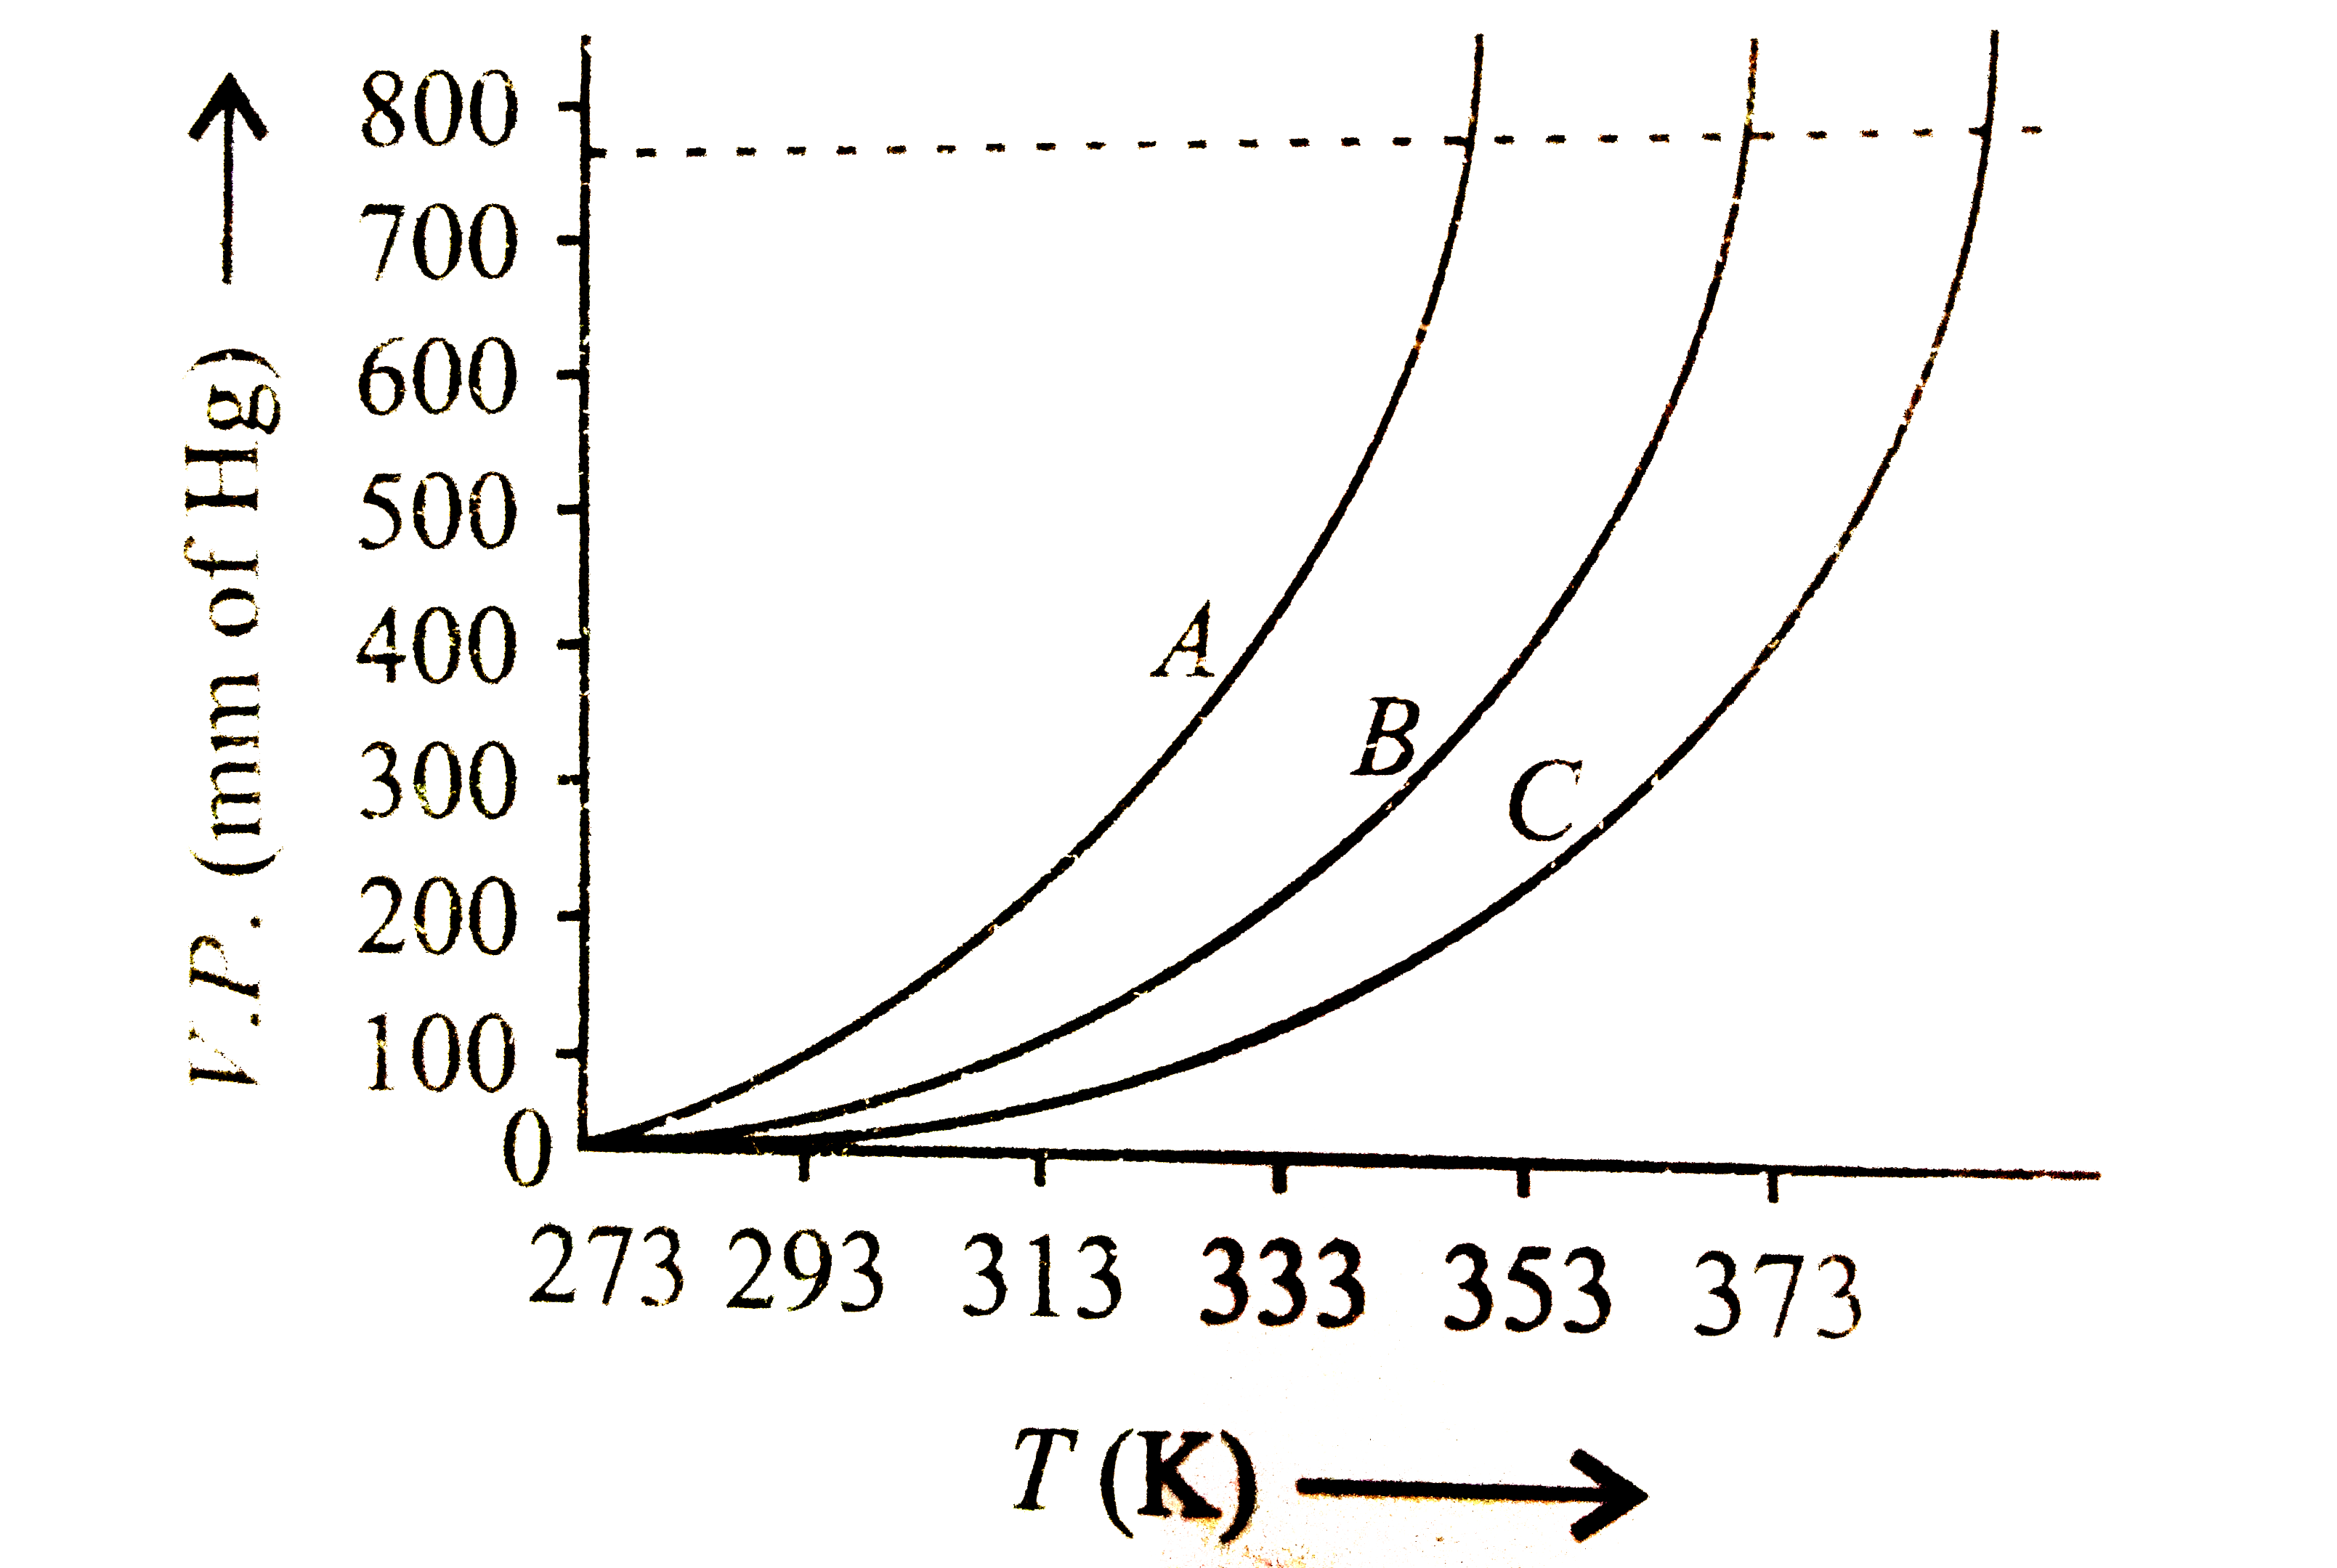
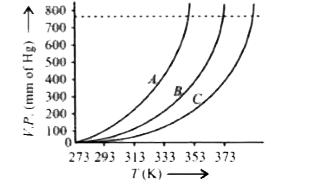
A graph between vapour pressure and temperature of few liquids is given below. Study the graph and answer following question.
Which of the following statements is not true?
Boiling point of a liquid is the temperature at which its vapour pressure becomes equal to atmospheric pressure.
Boiling point of water can be increased by increased the pressure above the atmospheric pressure
If liquid B is heated in a closed vessel it will boil at 353 K
Liquid C has higher boilingk point than B due to higher intermolecular forces.
Boiling does not occur when liquid is heated in a closed vessel.
Topper's Solved these Questions
- STATES OF MATTER (SOLIDS, LIQUIDS AND GASES)Book:MTG-WBJEEChapter:STATES OF MATTER (SOLIDS, LIQUIDS AND GASES)Exercise:WBJEE/WORKOUT (Category 3: One or More than one Option Correct Type)
Explore 9 Videos
- STATES OF MATTER (SOLIDS, LIQUIDS AND GASES)Book:MTG-WBJEEChapter:STATES OF MATTER (SOLIDS, LIQUIDS AND GASES)Exercise:WB JEE Previous Years Questions (Category 1: Single Option Correct Type)
Explore 14 Videos
- STATES OF MATTER (SOLIDS, LIQUIDS AND GASES)Book:MTG-WBJEEChapter:STATES OF MATTER (SOLIDS, LIQUIDS AND GASES)Exercise:WB JEE Previous Years Questions (CATEGORY 3; ONE OR MORE THAN ONE OPTION CORRECT TYPE(
Explore 1 Video
- REDOX EQUILIBRIABook:MTG-WBJEEChapter:REDOX EQUILIBRIAExercise:WB JEE PREVIOUS YEARS QUESTIONS
Explore 5 Videos
- SURFACE CHEMISTRYBook:MTG-WBJEEChapter:SURFACE CHEMISTRYExercise:WB JEE PREVIOUS YEARS QUESTIONS
Explore 3 Videos
Similar Questions
Knowledge Check
Study the graph carefully and answer the following questions.
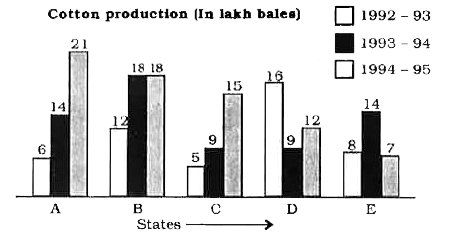
Which of the following statement is false ?AState A and E showed the same production in 1993-94.BThere was no improvement in the production of cotton in state B during 1994-95.CState A has produced maximum cotton during the given period.DProduction of state C and D together is equal to that of state B dring 1993-94.Study the following bar graph and answer the question that follows.
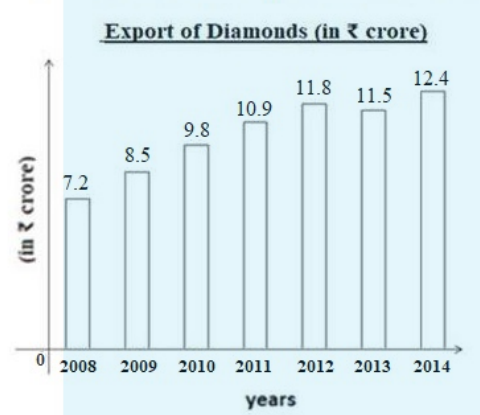
In which year was the maximin percentage increase in diamonds exports compared to the previous year?A2014B2009C2010D2012Examine the following graph carefully and answer the questions given below it :
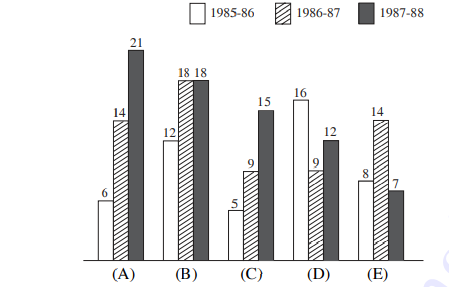
Which of the following statements is false ?AStates A and E showed the same production in 1986-87BThere was no improvement in the production of cotton in state B during 1987-88CState A has produced maximum cotton during the given periodDProducts of states C and D together is equal to that of state B during 1986-87
Study the bar graph and answer the following questions.
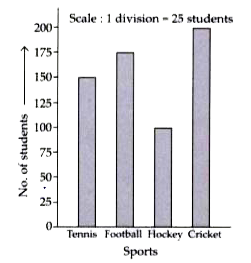
Which is the most popular sport ?
View SolutionStudy the bar graph and answer the following questions.
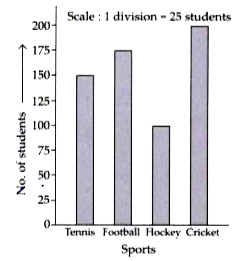
Which sport is preferred least ?
View SolutionObserve the graph and answer the following questions.
The temperature is maximum at
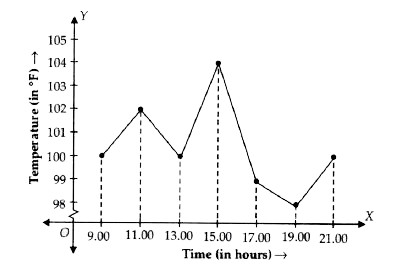
View SolutionObserve the graph and answer the following questions.
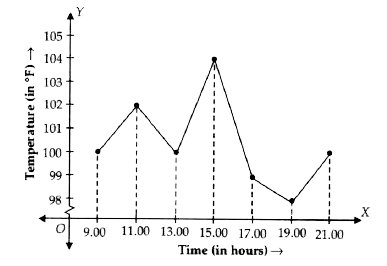
The temperature is minimum at
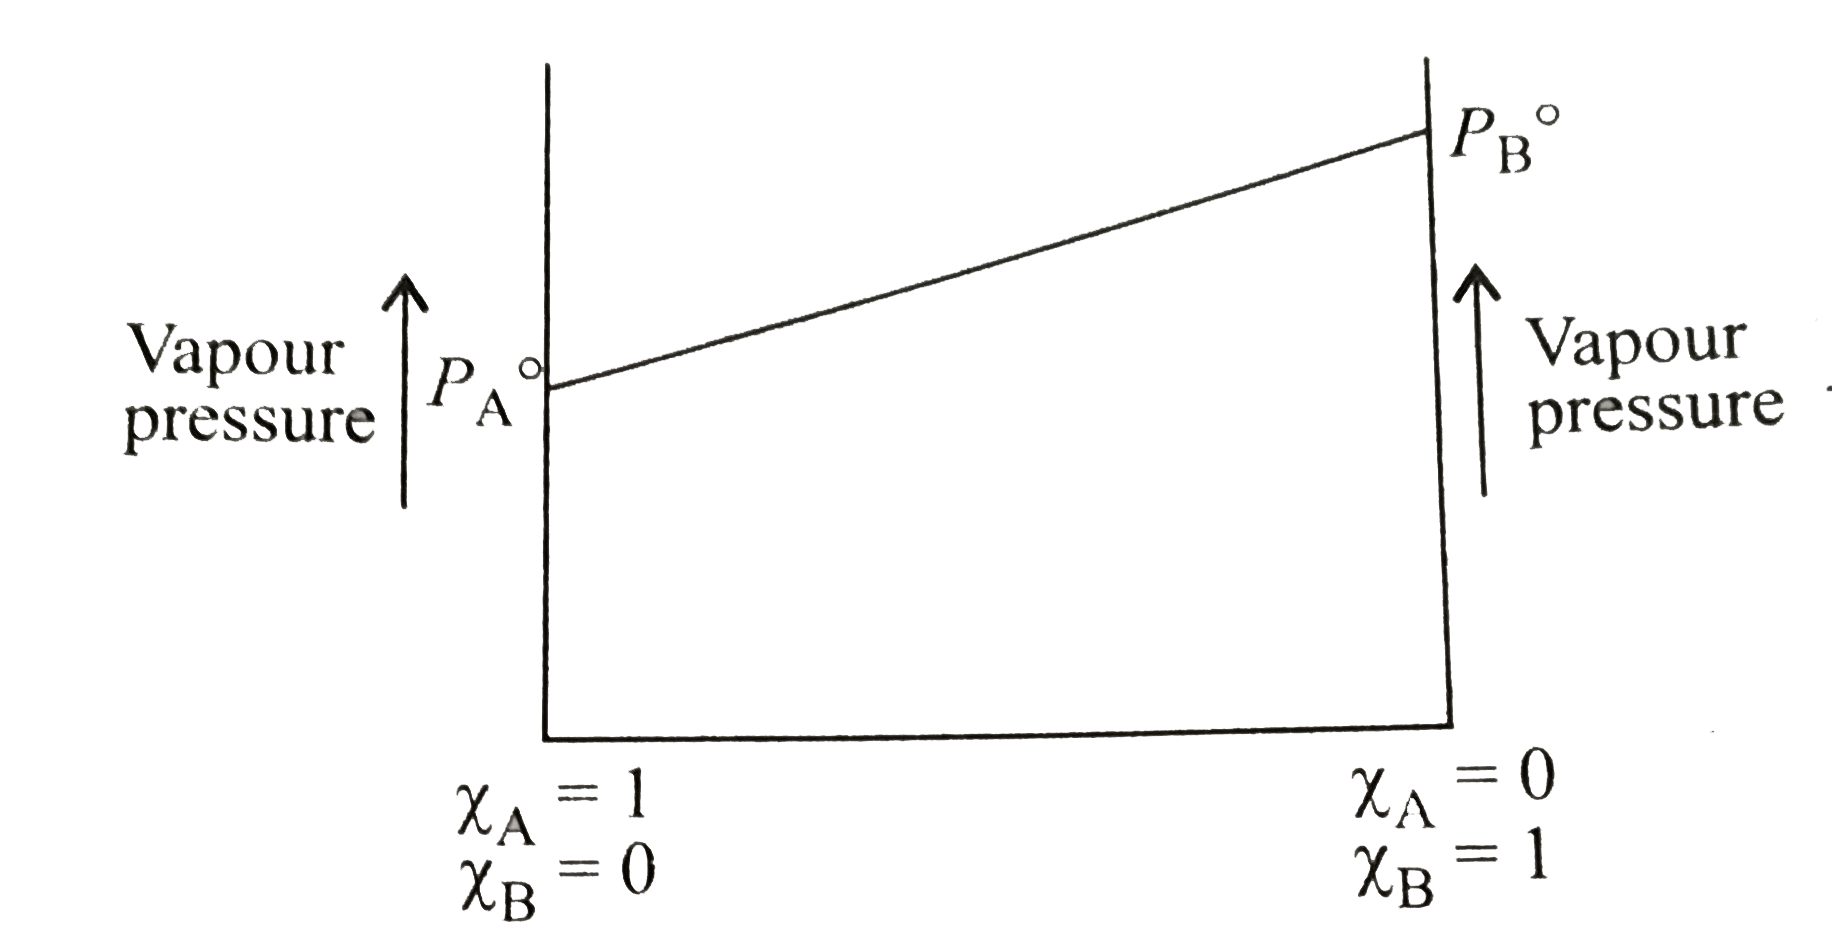
View SolutionThe following is a graph plotted between the vapour pressure of two volatile liquids against their respective mole fractions. Which of the following statements is/are correct?
View Solution

