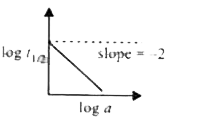
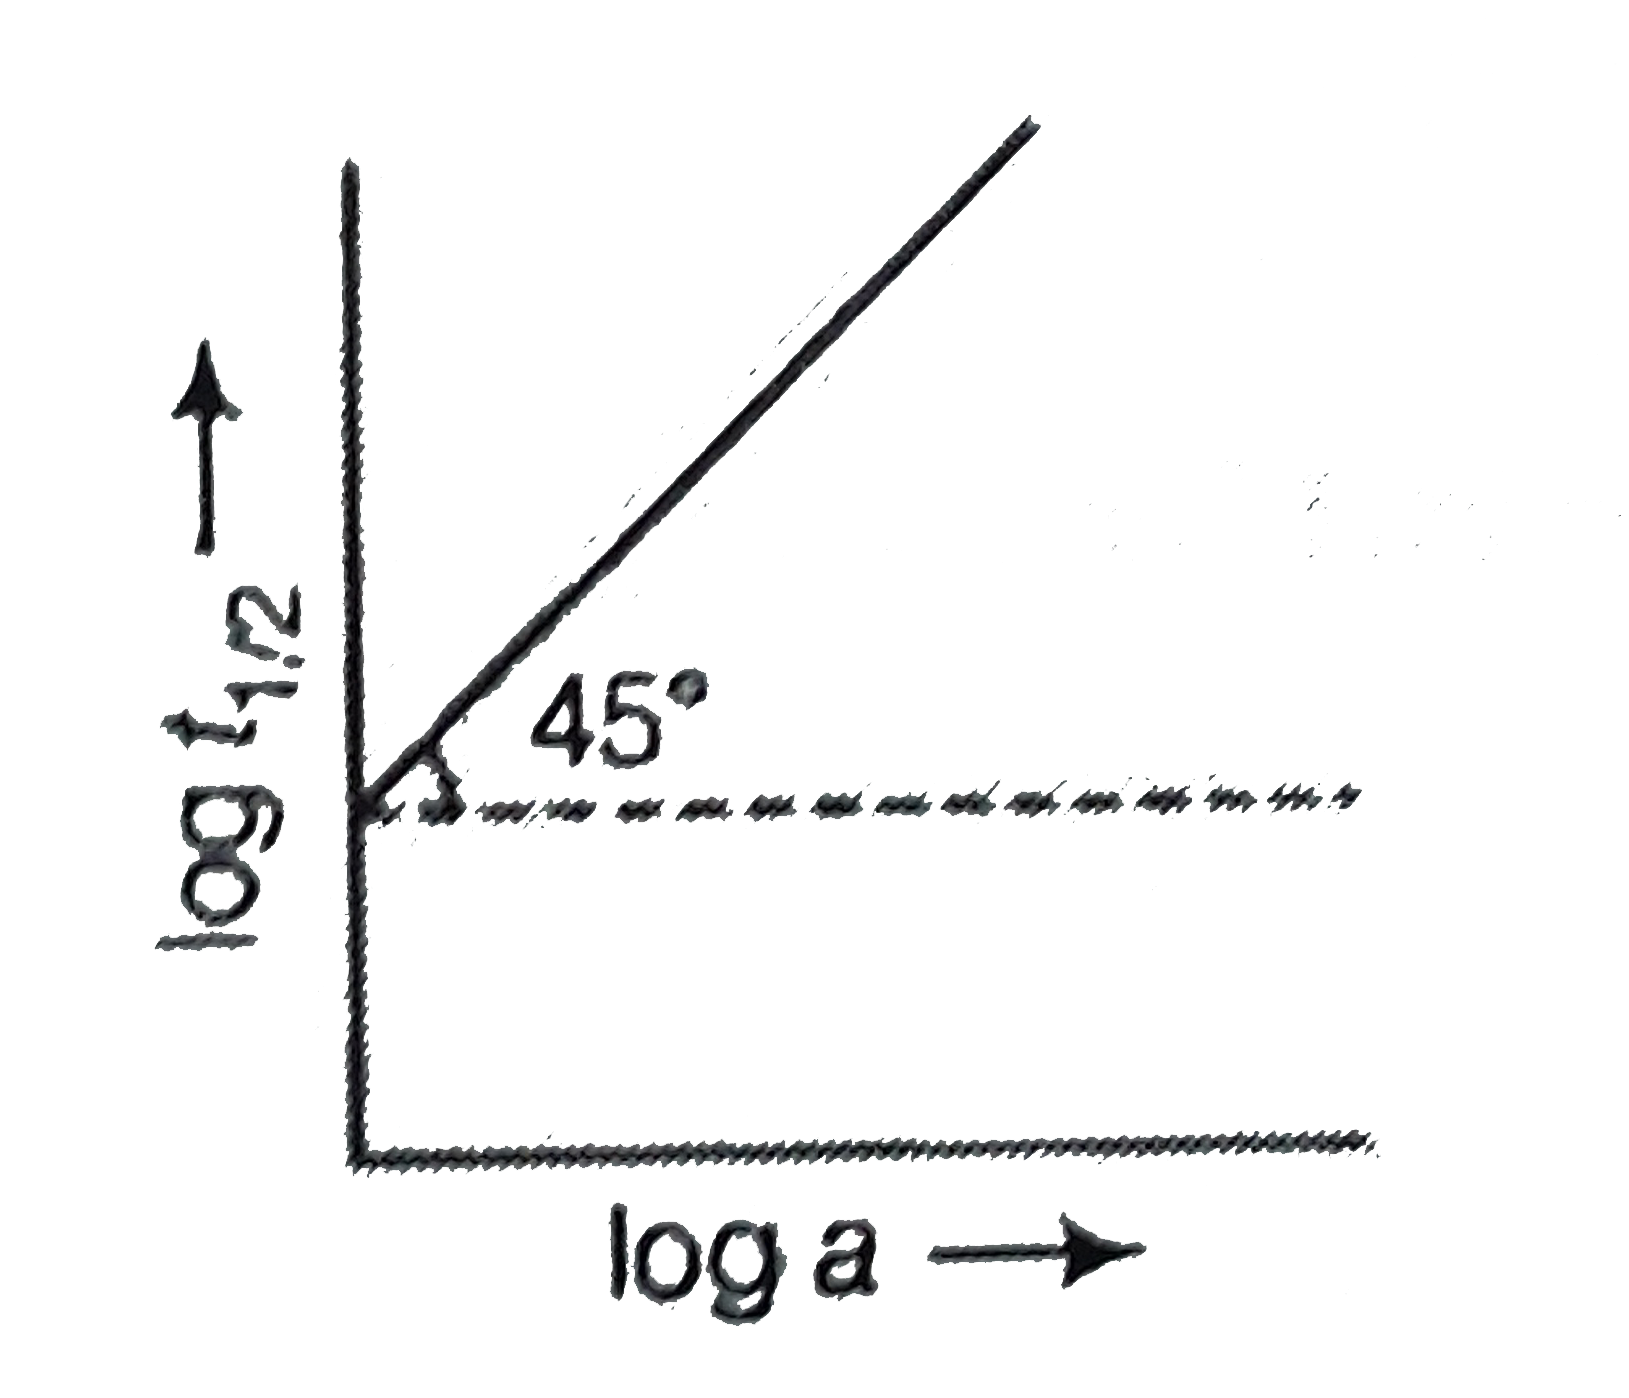
A graph between log and log a (abscissa), a being the initial concentration of A in the reaction A product, is depicted in the figure. The rate law is
The correct Answer is:d
, n being order, k=rate constant log =log k+(1-n)log a
Slope, (1-n) = -2, n = 3
Topper's Solved these Questions
- CHEMICAL DYNAMICS BOOK - MTG-WBJEECHAPTER - CHEMICAL DYNAMICS EXERCISE - WB JEE Previous Years Questions (CATEGORY 1 : Single Option Correct Type )(1 Mark)
4 Videos
- CHEMICAL DYNAMICS BOOK - MTG-WBJEECHAPTER - CHEMICAL DYNAMICS EXERCISE - WB JEE Previous Years Questions (CATEGORY 2: Single Option Correct Type )(2 Marks)
3 Videos
- CHEMICAL DYNAMICS BOOK - MTG-WBJEECHAPTER - CHEMICAL DYNAMICS EXERCISE - WB JEE Previous Years Questions (CATEGORY 3 : One or More than One Option Correct Type)(2 Marks)
2 Videos
- CHEMICAL BONDING AND MOLECULAR STRUCTUREBOOK - MTG-WBJEECHAPTER - CHEMICAL BONDING AND MOLECULAR STRUCTUREEXERCISE - WB JEE Previous Years Questons (Category 2 : One or More than one Option Correct Type )
3 Videos
- CHEMICAL ENERGETICSBOOK - MTG-WBJEECHAPTER - CHEMICAL ENERGETICSEXERCISE - WB JEE PREVIOUS YEARS QUESTIONS (ONE OR MORE THAN ONE OPTION CORRECT TYPE )
2 Videos
Similar Questions
A graph between logt12 and log a (abscissa), a being the initial concentration of A in the reaction For reaction A→Product, the rate law is :
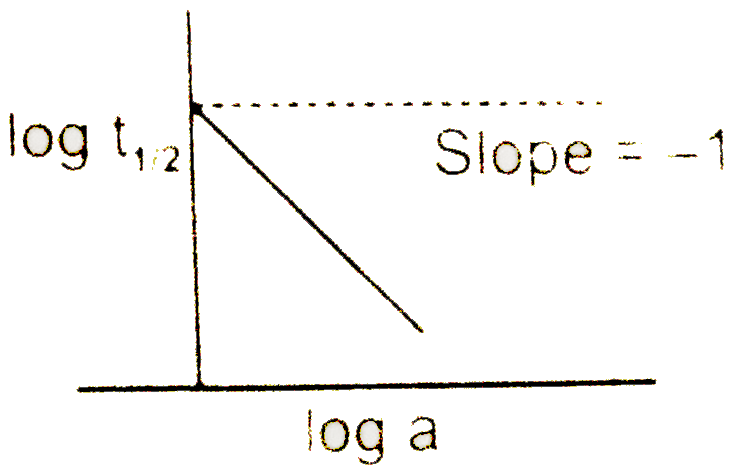
View SolutionA graph between logt12 and log a (abscissa), a being the initial concentration of A in the reaction For reaction A→Product, the rate law is :

View Solution
Knowledge Check
A graph between logt12 and log a (abscissa), a being the initial concentration of A in the reaction For reaction A→Product, the rate law is :
 A−d[A]dt=KB−d[A]dt=K[A]C−d[A]dt=K[A]2D−d[A]dt=K[A]3
A graph between logt12 and log a (abscissa), a being the initial concentration of A in the reaction For reaction A→Product, the rate law is :
 A−d[A]dt=kB−d[A]dt=k[A]C−d[A]dt=k[A]2D−d[A]dt=k[A]3
Following is the graph between logT50 and loga (a= initial concentration) for a given reaction at 27∘C. Hence order is
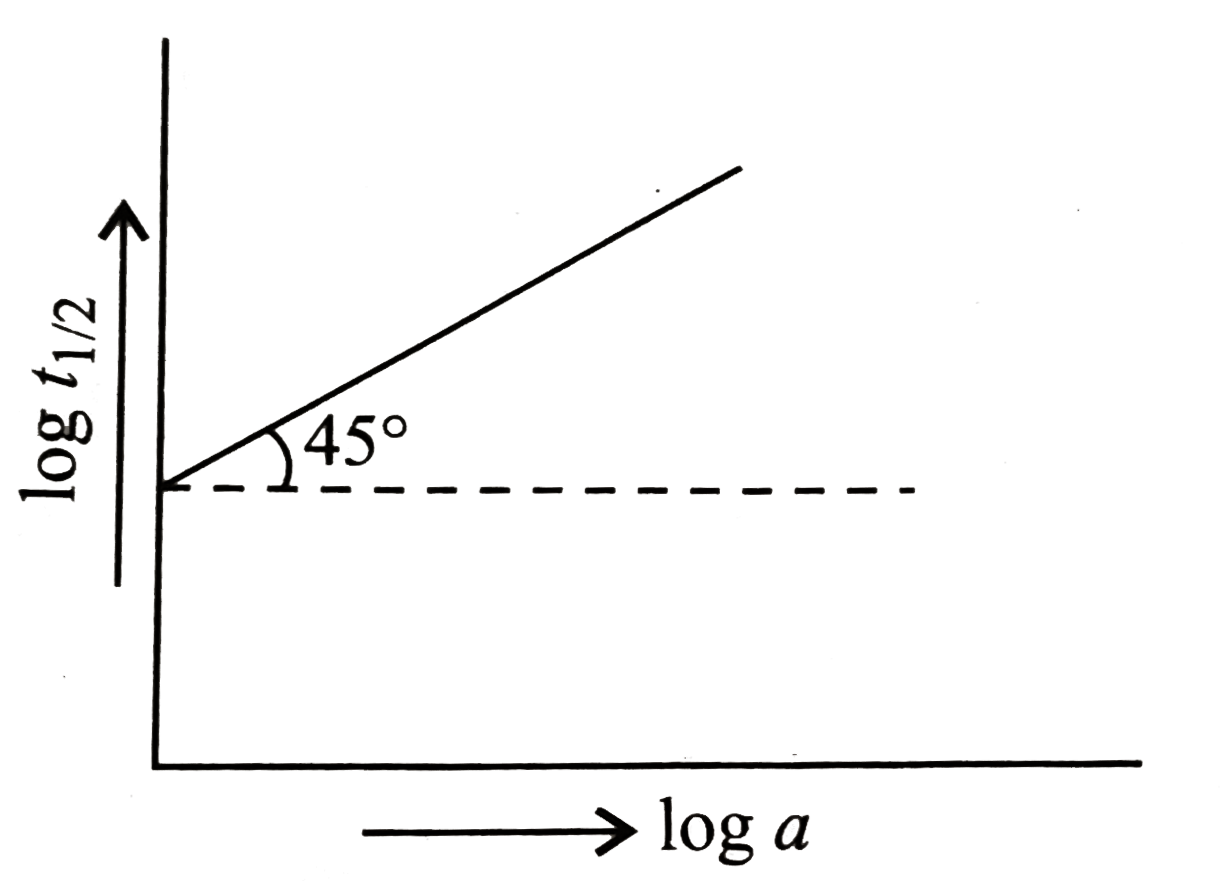 A0B1C2D3
Following is the graph between logt1/2 and loga (a initial concentration) for a given reaction at 300K

Find the order of reaction.
View SolutionFollowing is the graph between logT50 and loga (a= initial concentration) for a given reaction at 27∘C. Hence order is

View SolutionFollowing is the graph between logt1/2 and loga (a initial concentration) for a given reaction at 27∘C.

Find the order of reaction.
View SolutionThe graph between log t1/2 and log a at a given temperature is
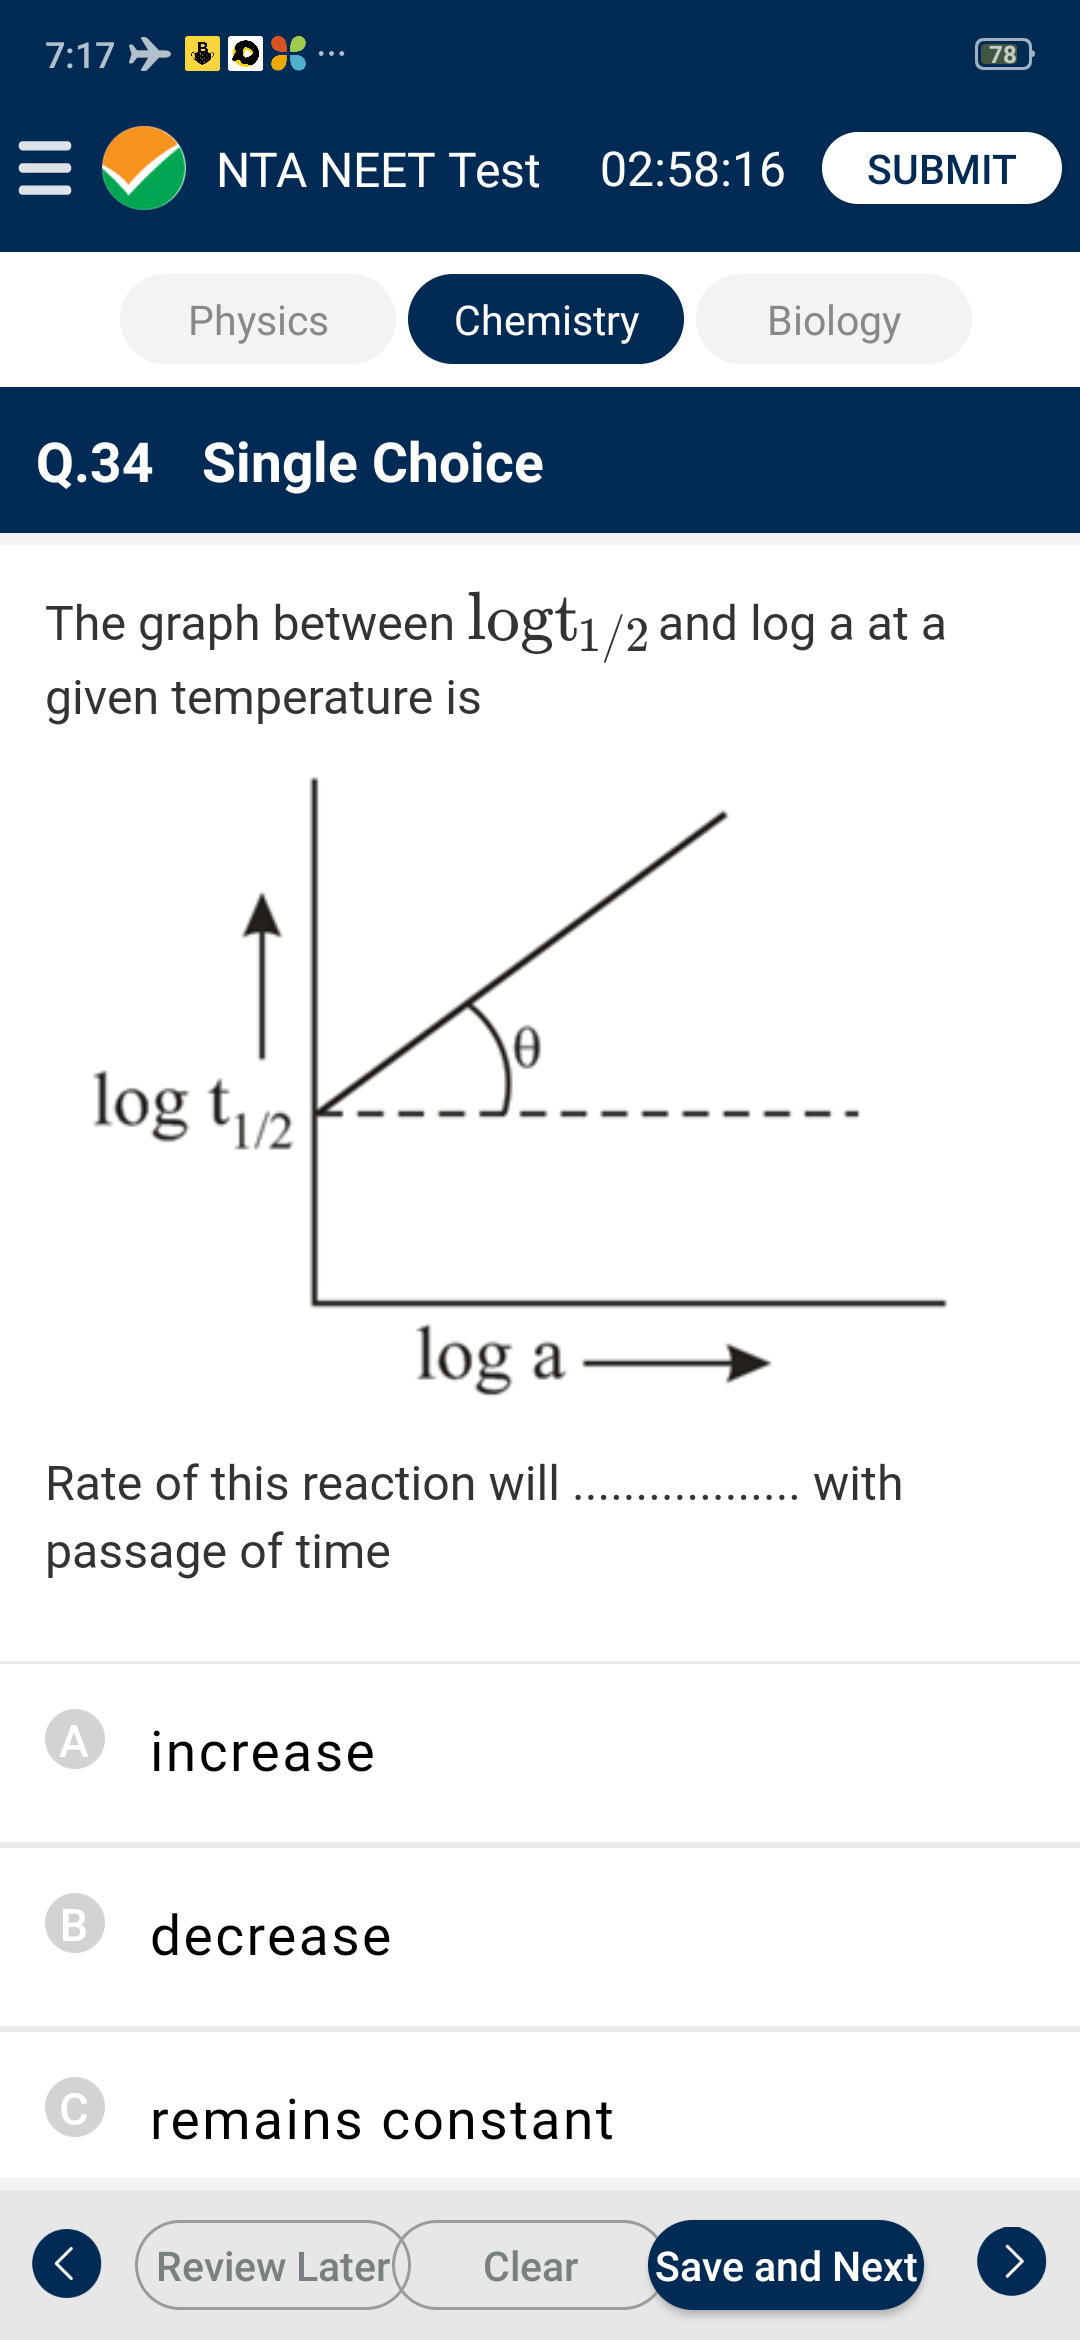
Rate of this reaction will …….with passage of time
View SolutionFollowing is the graph between log T50 and log a (a = initial concentration) for a given reaction at 27∘C.
Hence, order is
View Solution
