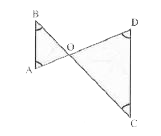
आकृति में, ∠B < ∠A और ∠C < ∠D है | दर्शाइए कि AD < BC है |

The correct Answer is:AD < BC
Topper's Solved these Questions
- त्रिभुज BOOK - SCIENCE PUBLICATIONCHAPTER - त्रिभुज EXERCISE - प्रश्नावली 7.3
5 Videos
- चतुर्भुज BOOK - SCIENCE PUBLICATIONCHAPTER - चतुर्भुज EXERCISE - प्रश्नावली 8.2 पर आधारित अभ्यास प्रश्न
7 Videos
- दो चरों वाले रैखिक समीकरणBOOK - SCIENCE PUBLICATIONCHAPTER - दो चरों वाले रैखिक समीकरणEXERCISE - प्रश्नावली 4.4 पर आधारित अभ्यास प्रश्न
1 Videos
Similar Questions
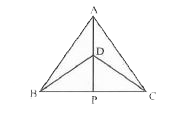
ΔABC और ΔDBC एक ही आधार BC पर बने दो समद्धिबाहू त्रिभुज इस प्रकार है कि A और D भुजा BC के एक ही ओर स्थित है | (देखिए आक्रति ) | यदि AD बढ़ाने पर BC को P पर प्रतिच्छेद करे, तो दर्शाइए कि-
(i) ΔABD ~-= ΔACD
(ii) ΔABP ~-= ΔACP
(iii) AP कोण A और कोण D दोनों को समद्धिभाजित करता है |
(iv) AP रेखाखण्ड BC का लम्ब समद्धिभाजक है |
View SolutionP, Q और R क्रमशः एक समबाहु त्रिभुज ABC की भुजाओं BC, CA और AB के मध्य बिन्दु है। सिद्ध कीजिए कि ΔPQR भी एक समबाहु त्रिभुज हैं।
View Solutionनिम्नलिखित समीकरणों को (i) संख्या रेखा और तथा (ii) कार्तिए तल पर प्रदर्शित कीजिए।
(a) x−2=0 " (b)2x+4=3x+1
(c) y+5=0
View SolutionHow many lines of symmetry does the above figure have ?
View SolutionWhich of the following are correct chain isomers of butane ? (i)
View SolutionDetermine the point of symmetry of a regular hexagon.
View SolutionDtermine the images of the following figure about the given line :
View SolutionIn the figure above (not to scale), ¯¯¯¯¯¯AB⊥¯¯¯¯¯¯CDandAD is the bisector of ∠BAE.AB=3cm and AC=5cm. Find CD.
View SolutionMatch the following Column A to Column B

View SolutionMatch the following Column A to Column B

View SolutionMatch the following Column A to Column B

View SolutionFind the area of the figure given below.

View SolutionThe area of the shaded part in the figure given below is ______.

View SolutionThe inequation represented by the graph given below is :
View SolutionThe inequation that best describes the graph given below is _________
View SolutionThe inequation that best describes the following graph is _________
View Solution
