Two hundred students of 6th and 7th class were asked to name their favourite colour so as to decide upon what should be the colour of their School Building. The results are shown in the following table. Represent the given data on a bar graph.
1)Blue is the most preferred and green is the least preferred.
2)There are total of 5 colors.
Topper's Solved these Questions
- BOOK - NCERTCHAPTER - DATA HANDLINGEXERCISE - EXERCISE 3.44videos
DATA HANDLING
- BOOK - NCERTCHAPTER - DATA HANDLINGEXERCISE - EXERCISE 3.18videos
DATA HANDLING
- BOOK - NCERTCHAPTER - CONGRUENCE OF TRIANGLESEXERCISE - SOLVED EXAMPLES9videos
CONGRUENCE OF TRIANGLES
- BOOK - NCERTCHAPTER - EXPONENTS AND POWERSEXERCISE - EXERCISE 13.34videos
EXPONENTS AND POWERS
Similar Questions
Two hundred students of 6th and 7th class were asked to name their favourite colour so as to decide upon what should be the colour of their School Building. The results are shown in the following table. Represent the given data on a bar graph.
View SolutionVikash went to vegetable market with his elder sister, a M.Sc Botany student. There he saw many varieties of different vegetables such as different kinds of chilies (short, long, round, pungent, less pungent, green reddish, orange), several varieties of potato and tomatoes. He asked his sister the following questions.
(i) What is the need of producing so many varieties of different crop plants.
(ii) What is the name of branch of science which deals with crop improvement ?
(iii) What are the methods used by plant breeders ?
(iv) What is hybridization ?View Solution
Knowledge Check
- Question 1 - Select One
A survey was taken at a high school, and the results were put in a circle graph. The students were asked to list their favourite colours. The measurement of each central angle is shown. If a person is chosen at random from the school, find the probability of each response.
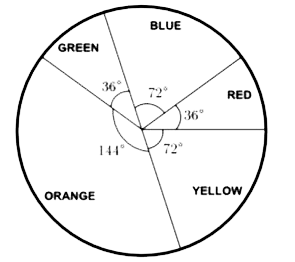
What is the probability of favourite colour not being orange or green ?A0.65B0.75C0.25D0.50 - Question 2 - Select One
A survey was taken at a high school, and the results were put in a circle graph. The students were asked to list their favourite colours. The measurement of each central angle is shown. If a person is chosen at random from the school, find the probability of each response.
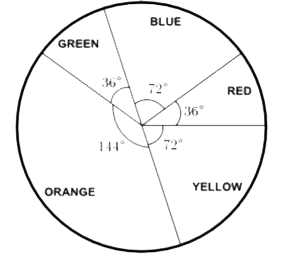
What is the probability of favourite colour not being red or blue?A0.35B0.7C0.15D0.50 - Question 3 - Select One
A survey was taken at a high school, and the results were put in a circle graph. The students were asked to list their favourite colours. The measurement of each central angle is shown. If a person is chosen at random from the school, find the probability of each response.
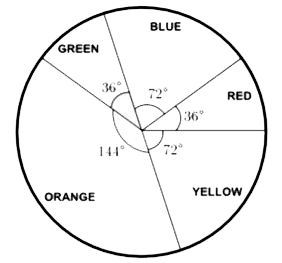
What is the probability of favourite colour being red ?A0.1B0.2C0.3D0.4
A survey was taken at a high school, and the results were put in a circle graph. The students were asked to list their favourite colours. The measurement of each central angle is shown. If a person is chosen at random from the school, find the probability of each response.
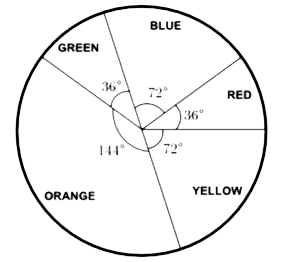
What is the probability of favourite colour being blue or green ?View SolutionA survey was taken at a high school, and the results were put in a circle graph. The students were asked to list their favourite colours. The measurement of each central angle is shown. If a person is chosen at random from the school, find the probability of each response.
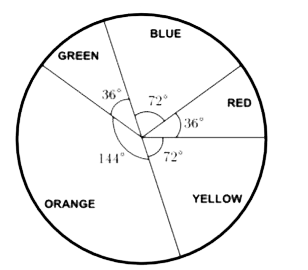
What is the probability of favourite colour being red or blue?View SolutionThe Indian education sector is one of the largest sunrise sectors contributing to the country's economic and social growth. The Indian education system, considered as one of the largest in the world, is divided into two major segments of core and non-core businesses. While, schools and higher education form the core group, the non-core business consists of pre-schools, vocational traiking and coaching classes. The education sector in India is evolving, led by the emergence of new niche sectors like vocational training, finishing schools, child-skill enhancement and e-learniti.g. India has emerged as a strong potential market for investments in training and education sector, due to its favourable demographics (young population) and being a services-driven economy. Indian education sector's market size in Financial Year, 2012-13 estimated to be USD 71.2 billion is expected to increase to USO 109.8 billion by Financial Year 2015-2016 due to the expected strong demand for quanity education. The market .grew at a CAGR of 16.51/o durmg Financial Year 2015-2016. Financial Year 2005-2012.
Education has been made an important and integral part of the national development efforts . . The tremendous increase in the num-ber of students and of educational institutions has given rise to the term 'equcation explosion'. No doubt, th.is has resulted in serious problems such as inadequacy of financial resources and infrastructure and dilution of personal attention to the education and character-formation of the students. Also there is the unwanted side-effect of enormous increase in the number of educated unemployed. However, we cannot overlook the advantages o.f education explosion in India. Mere increase in the percentage ofliterate people does not indicate a qualitative change in the educational standards of the people and a substantial · improvement in manpower resources of India. Unemployment problem in India cannot be blamed on the availability of large masses of educated people in India.
Uncertainty and vacillation have marked the government's policy regarding the medium of education in India. While the government policy in this respect has not changed, a significant increase in the number of schools-primary and secondary-imparting education through the English medium is a significant development: thousands of nursery schools that have mushroomed since the last decade purport to impart education to infants through English. This is an unwanted development which has been deprecated by educationalists and political leaders. Regarding the medium of instruction in colleges and universities, many State Governments have already decided, in principle, to switch over to the regional language. However the implementation in this respect has remained very slow.
Today virtually every university in India is offering correspondence courses for different degrees and diplomas. In fact correspondence education has opened new vistas for the educational system which could not successfully meet the challenging problem of providing infrastructure for multitudes o( new entrants into tlie portals of higher education. The public demand for higher education was·initially met through evening colleges, now correspondence education has come to the rescue of the worried education administrators.
Which of the following can be inferred as per the passage?
A. Increase in literacy levels signifies a qualitative increase in educational attainment of people.
B. Literacy levels are closely related to improvement in manpower resources.
C. The existence of educated people does not necessarily contribute to the problem of unemployment.View SolutionEach of the questions below consists of a question and two statements numbered I and II given below it. You have to decide whether the data provided in the statements are sufficient to answer the question. Read both the statements and - What is the position of S in class of 40 students ? I.P's rank is three below than that ofS.P is 7th from the bottom in the class. II.There are 17 students between A and S and 5 students between Sand B in the class
View SolutionEach of the questions below consists of a question and two statements numbered I and II given below it. You have to decide whether the data provided in the statements are sufficient to answer the question. Read both the statements and -
How is M related to K ?
I. P's rank is three below than that of S.P. is 7th from the bottom in the class.
II. There are 17 students between A and S and 5 students between S and B in the class.View Solution

