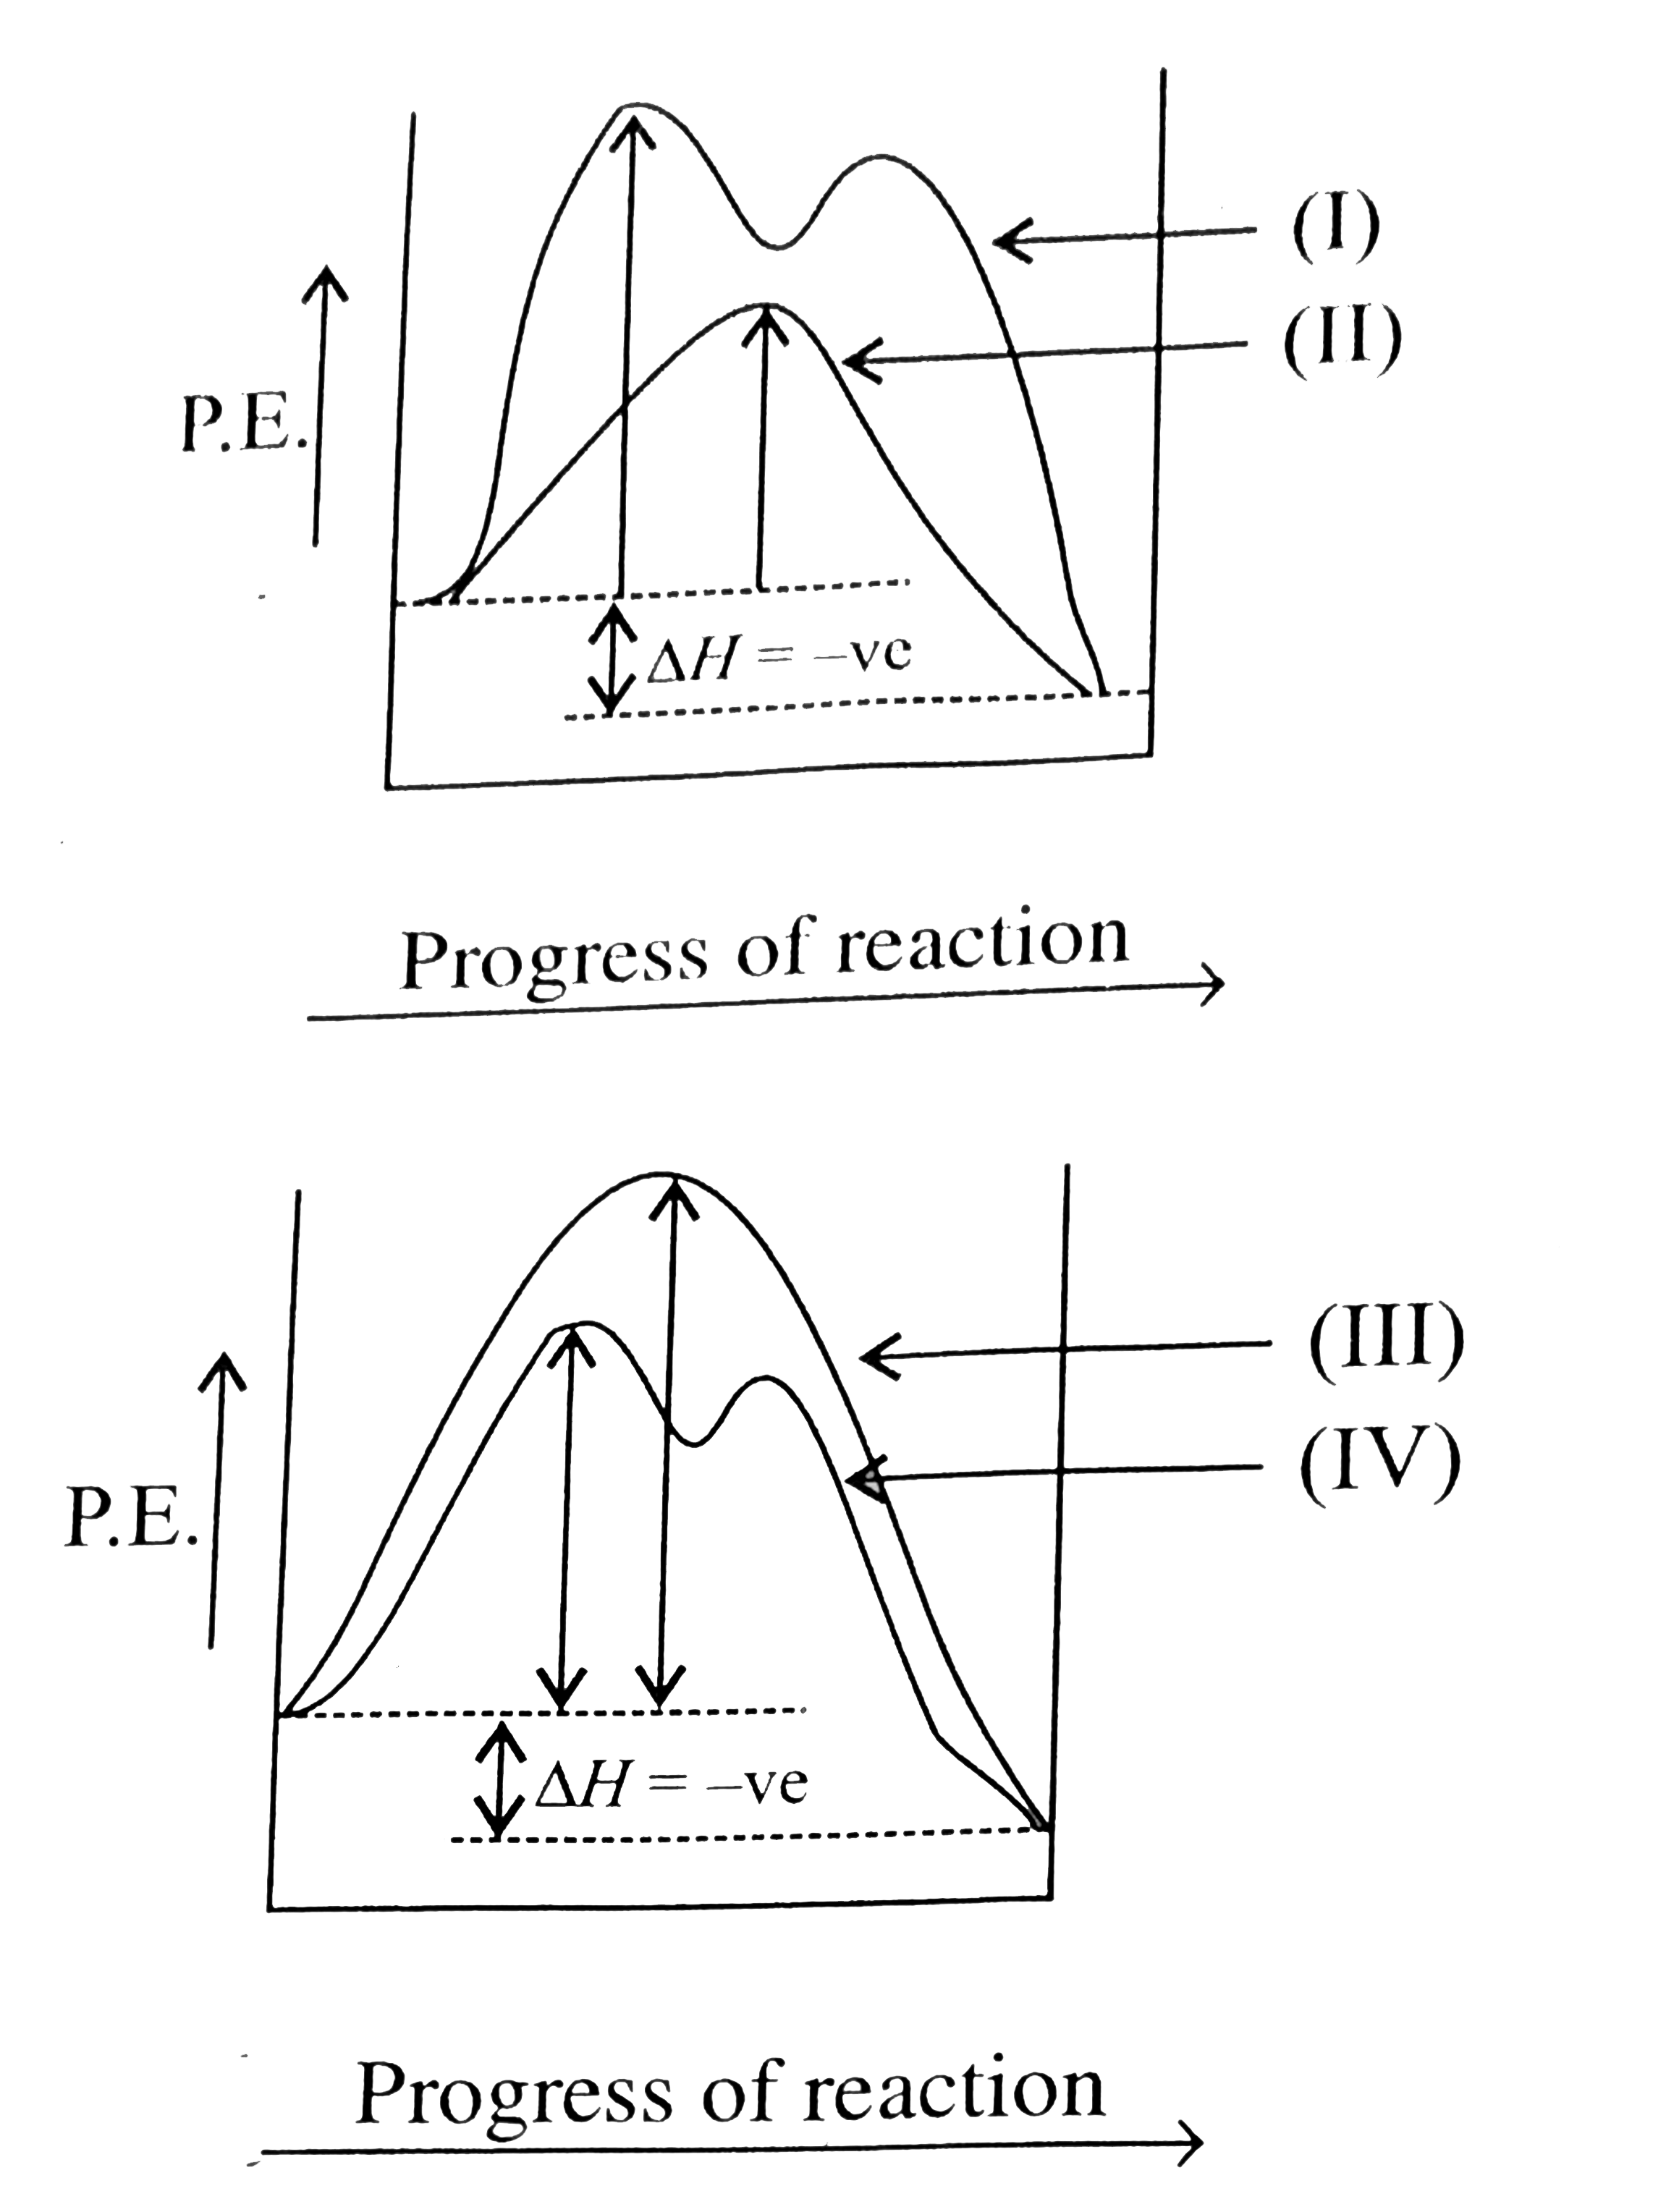
Energy diagram of SN1 and SN2 reactions. The order of hydrolysis of RX by SN1 is 3∘>2∘1∘RX and by SN2 path is 1∘>2∘>3∘RX.

A
(I) is Fig, (a) and (IV) in Fig, (b) represent SN1 reaction.
B
(II) in Fig. (a)and(III)∈Fig(b)nrepresentSN^(2) reaction.
C
Fig (a) and Fig (b) are the energy diagrams for 1∘RX and 3∘RX, respectively.
D
Fig (a) and Fig (b) are the energy diagram for 3∘RX and 1∘RX, respectively.
Text Solution
The correct Answer is:(a,b,c)
SN1 has two steps and has two transition state intermediate carbocations in the first, higher T.S.(C−X) bond streches (R3C+δ....X−δ).
In the second, lower T.S. Bond formaition between carbocation and a nucleophiclic takes place (R3C+δ.....No−u).
So in Figs, (a) and (b) , (I) and (IV) represent SN−1 reaction, respectively.
SN2 has one step, has one T.S and no intermediate. So in Figs, (a) and (b),(II) and (III) represent SN2 reactions respectively.
The hydrolsis of RX by SN1 path is 3∘>2∘>1∘ and by SN2 path is 1∘>2∘>3∘.
Therefore, Fig (a) represents hydrolysis of 1∘RX since SN2 path is of lower energy.
Figure (b) represents hydrolysis of 3RX, since SN1 path is of lower energy.
So statements (a), (b), and (c) correct.
|
Topper's Solved these Questions
- AROMATIC COMPOUNDS AND ALKYL AND ARYL HALIDES BOOK - CENGAGE CHEMISTRYCHAPTER - AROMATIC COMPOUNDS AND ALKYL AND ARYL HALIDES EXERCISE - Exercises Single Correct
161 Videos
- AROMATIC COMPOUNDS AND ALKYL AND ARYL HALIDES BOOK - CENGAGE CHEMISTRYCHAPTER - AROMATIC COMPOUNDS AND ALKYL AND ARYL HALIDES EXERCISE - Exercises Single Correct Answer Type
26 Videos
- AROMATIC COMPOUNDS AND ALKYL AND ARYL HALIDES BOOK - CENGAGE CHEMISTRYCHAPTER - AROMATIC COMPOUNDS AND ALKYL AND ARYL HALIDES EXERCISE - Exercises Multiple Correct
35 Videos
- APPENDIX INORGANIC VOLUME 2BOOK - CENGAGE CHEMISTRYCHAPTER - APPENDIX INORGANIC VOLUME 2EXERCISE - Short Answer Type
179 Videos
- BIOMOLECULESBOOK - CENGAGE CHEMISTRYCHAPTER - BIOMOLECULESEXERCISE - Exercises Archives (Analytical And Descriptive)
8 Videos
Similar Questions
SN1 and SN2 reaction
View SolutionSN1 and SN2 mechanisms
View SolutionSn1 and Sn2 reaction
View SolutionSN1 and SN2 Reaction
View SolutionComparision of SN1 and SN2 Reaction
View SolutionSN1 and SN2 Reactions Part-3
View SolutionSN1 and SN2 Reactions Part-1
View SolutionSN1 and SN2 Reactions Part-2
View SolutionProblems based on SN1 and SN2 reactions
View SolutionThe first steps of SN1 and SN2 recatiosns are, respectively
View Solution
