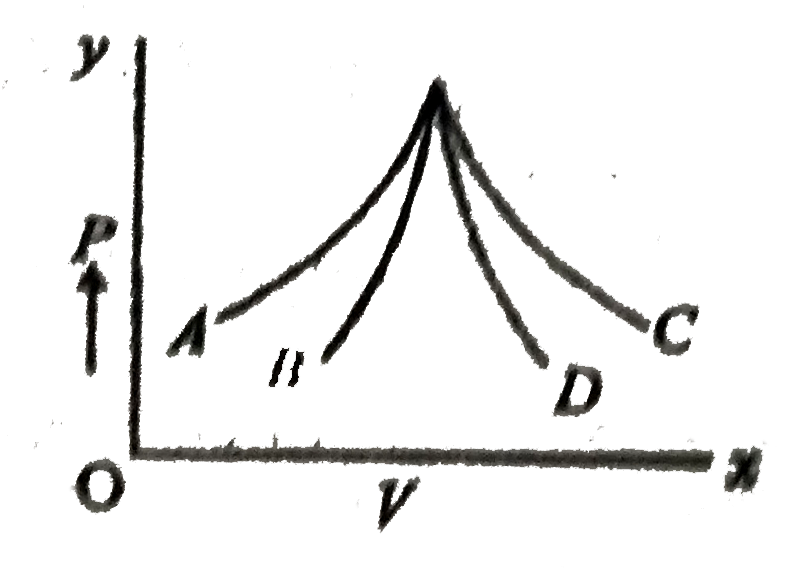
Figure shows four PV diagrams. Which of these curves represent isothermal and adiabatic processes?
A
C and D
B
A and C
C
A and B
D
B and D.
Video Solution
Text Solution
The correct Answer is:a
In curves A and B, pressure and volume both increase. Therefore, temperature must rise and heat must be supplied/work is done. Therefore A and B cannot be required curves. Out of C and D, slope of C is smaller. Therefore, C is isothermal curve and D is adiabatic curve.
|
Updated on:21/07/2023
Topper's Solved these Questions
- BOOK - MTG-WBJEECHAPTER - THERMODYNAMICSEXERCISE - WB JEE WORKOUT ( CATEGORY 2 : Single Option Correct Type (2 Mark )15videos
THERMODYNAMICS
- BOOK - MTG-WBJEECHAPTER - THERMODYNAMICSEXERCISE - WB JEE WORKOUT ( CATEGORY 3 : One or Mare than One Option Correct Type (2 Mark )10videos
THERMODYNAMICS
- BOOK - MTG-WBJEECHAPTER - SOLID STATE ELECTRONS EXERCISE - WB JEE Previous Years Questions (CATEGORY 1 : Single Option Correct Type)15videos
SOLID STATE ELECTRONS
- BOOK - MTG-WBJEECHAPTER - WAVE OPTICSEXERCISE - WB JEE PREVIOUS YEARS QUESTION (MCQ.s)9videos
WAVE OPTICS
Similar Questions
Knowledge Check
- Question 1 - Select One
A cyclic process ABCD is shown in the figure P - V diagram. Which of the following curves represent the same process
 A
A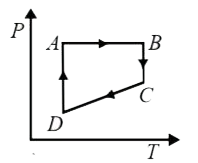 B
B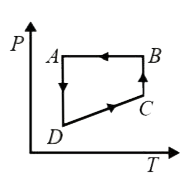 C
C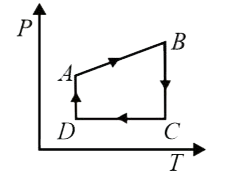 D
D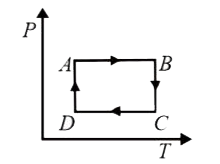
- Question 2 - Select One
A cyclic process ABCD is shown in the figure P - V diagram. Which of the following curves represent the same process
 A
A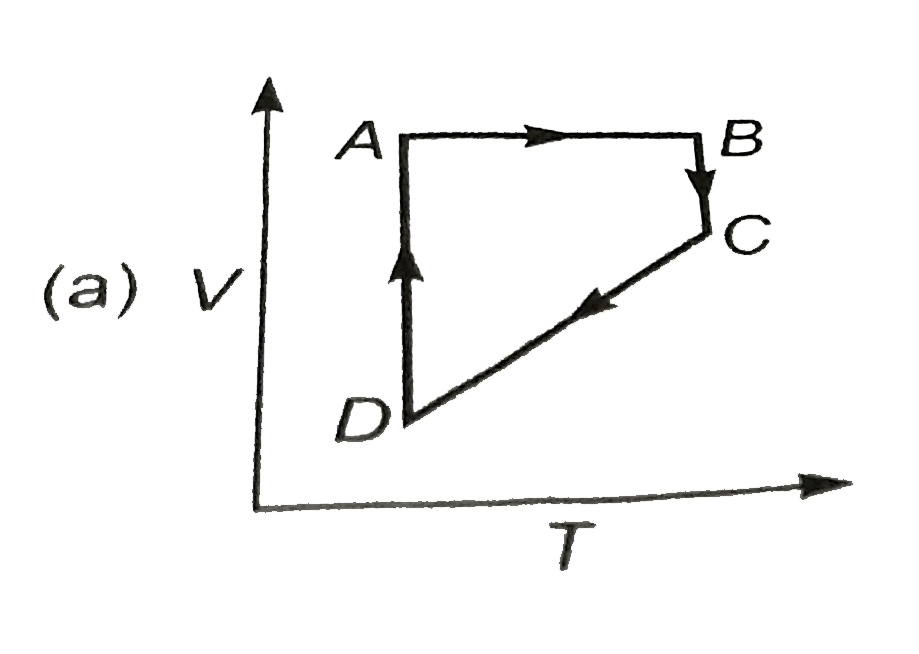 B
B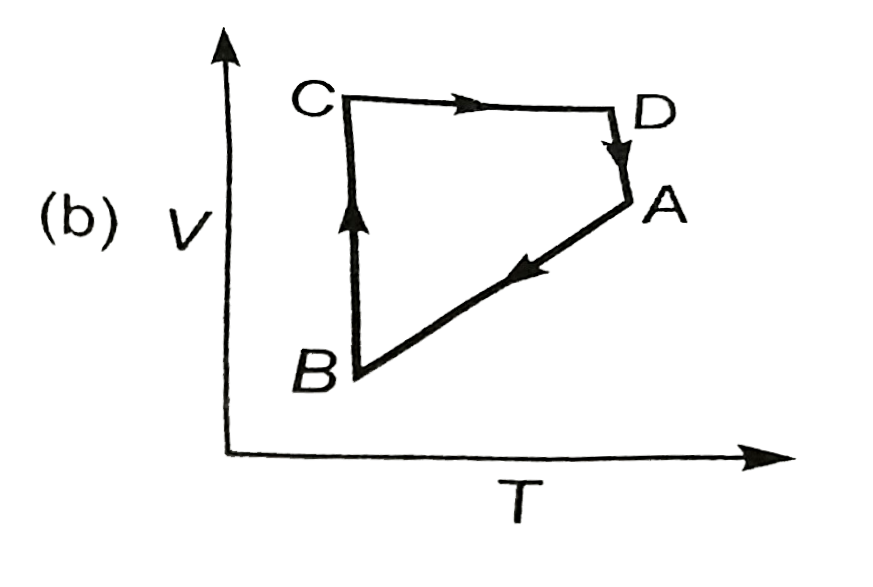 C
C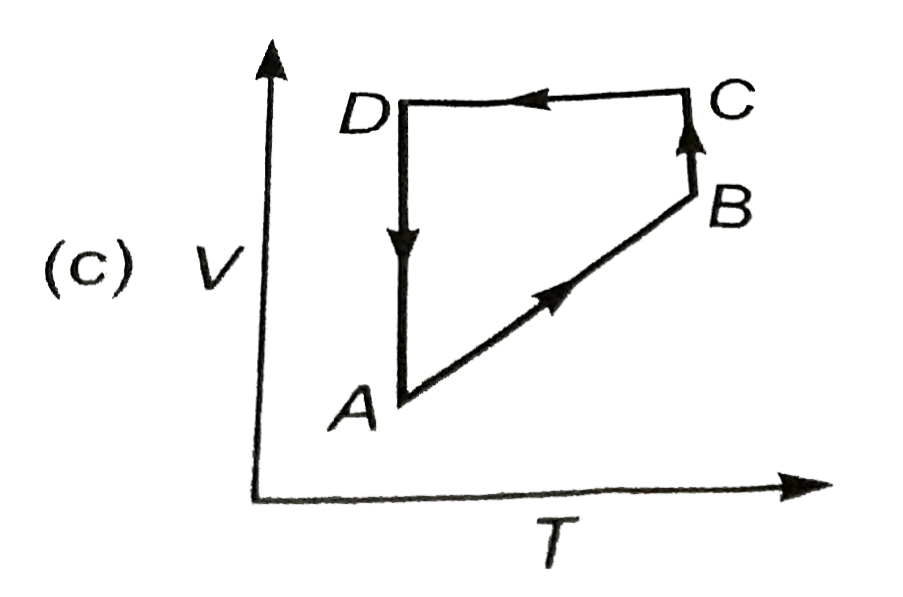 D
D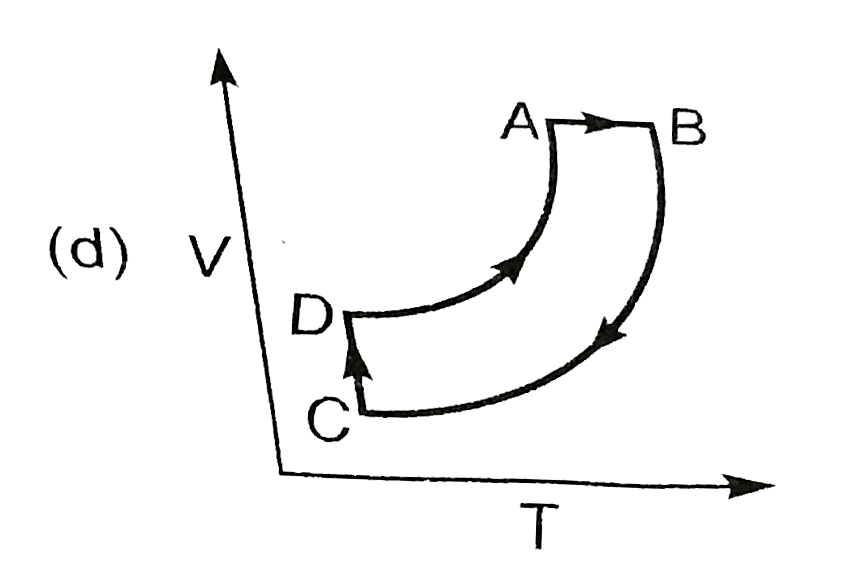
- Question 3 - Select One
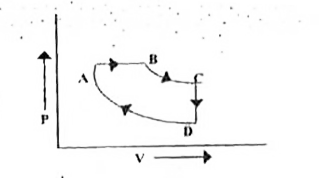
A cyclic process ABCD is shown in the figure P-V diagram. Which of the following curves represent the same process?
 A
A B
B C
C D
D
Analysis OF Isothermal and Adiabatic Process
View SolutionIsothermal Process and Adiabatic Process.
View SolutionComparison Between Isothermal And Adiabatic Process
View SolutionIsothermal and adiabatic process are identical.
View SolutionWhich of the following P-V curve best represents. As isothermal process?
View Solution
