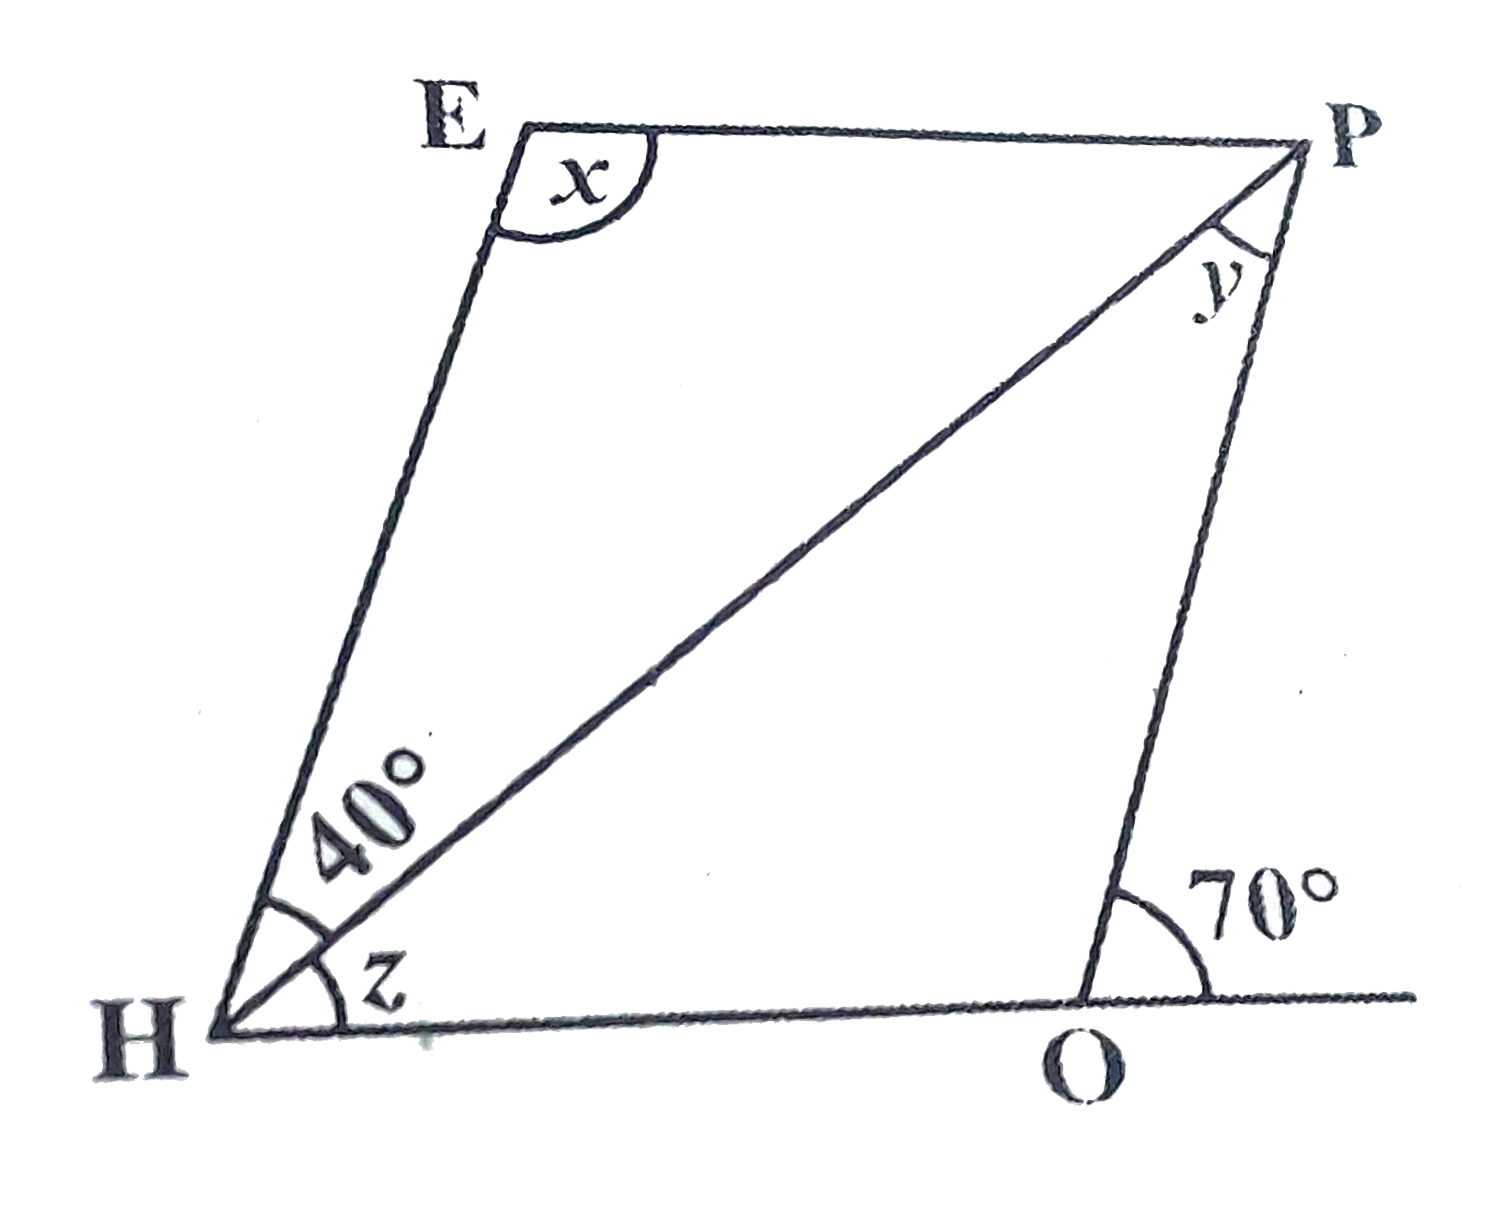
संलग्न आकृति HOPE एक समांतर चतुर्भुज है | x, y और z कोणों की माप ज्ञात कीजिए | ज्ञात करने में प्रयोग किए गए गुणों को बताइए |

x=110∘;y=40∘;z=30∘
x=100∘;y=40∘;z=30∘
x=110∘;y=50∘;z=30∘
x=110∘;y=40∘;z=60∘
The correct Answer is:A
Step by step video & image solution for संलग्न आकृति HOPE एक समांतर चतुर्भुज है | x, y और z कोणों की माप ज्ञात कीजिए | ज्ञात करने में प्रयोग किए गए गुणों को बताइए | by Maths experts to help you in doubts & scoring excellent marks in Class 8 exams.
Updated on:21/07/2023Topper's Solved these Questions
- चतुर्भुजों को समझना BOOK - NCERT HINDICHAPTER - चतुर्भुजों को समझना EXERCISE - प्रश्नावली 3.4
6 Videos
- चतुर्भुजों को समझना BOOK - NCERT HINDICHAPTER - चतुर्भुजों को समझना EXERCISE - प्रश्नावली 3.2
6 Videos
- घातांक और घातBOOK - NCERT HINDICHAPTER - घातांक और घातEXERCISE - प्रयास कीजिए
5 Videos
- ठोस आकारों का चित्रण BOOK - NCERT HINDICHAPTER - ठोस आकारों का चित्रण EXERCISE - प्रश्नावली 10.3
8 Videos
Similar Questions
बताइए, कथन सत्य है या असत्य :
(a) सभी आयत वर्ग होते है
(b) सभी सम चतुर्भुज समांतर चतुर्भुज होते हैं
(c) सभी वर्ग सम चतुर्भुज और आयत
(d) सभी वर्ग समांतर चतुर्भुज नहीं होते |
(e) सभी पतंगे सम चतुर्भुज होती है
(f) सभी सम चतुर्भुज समलम्ब होते है |
(h) सभी वर्ग समलंब होते हैं |
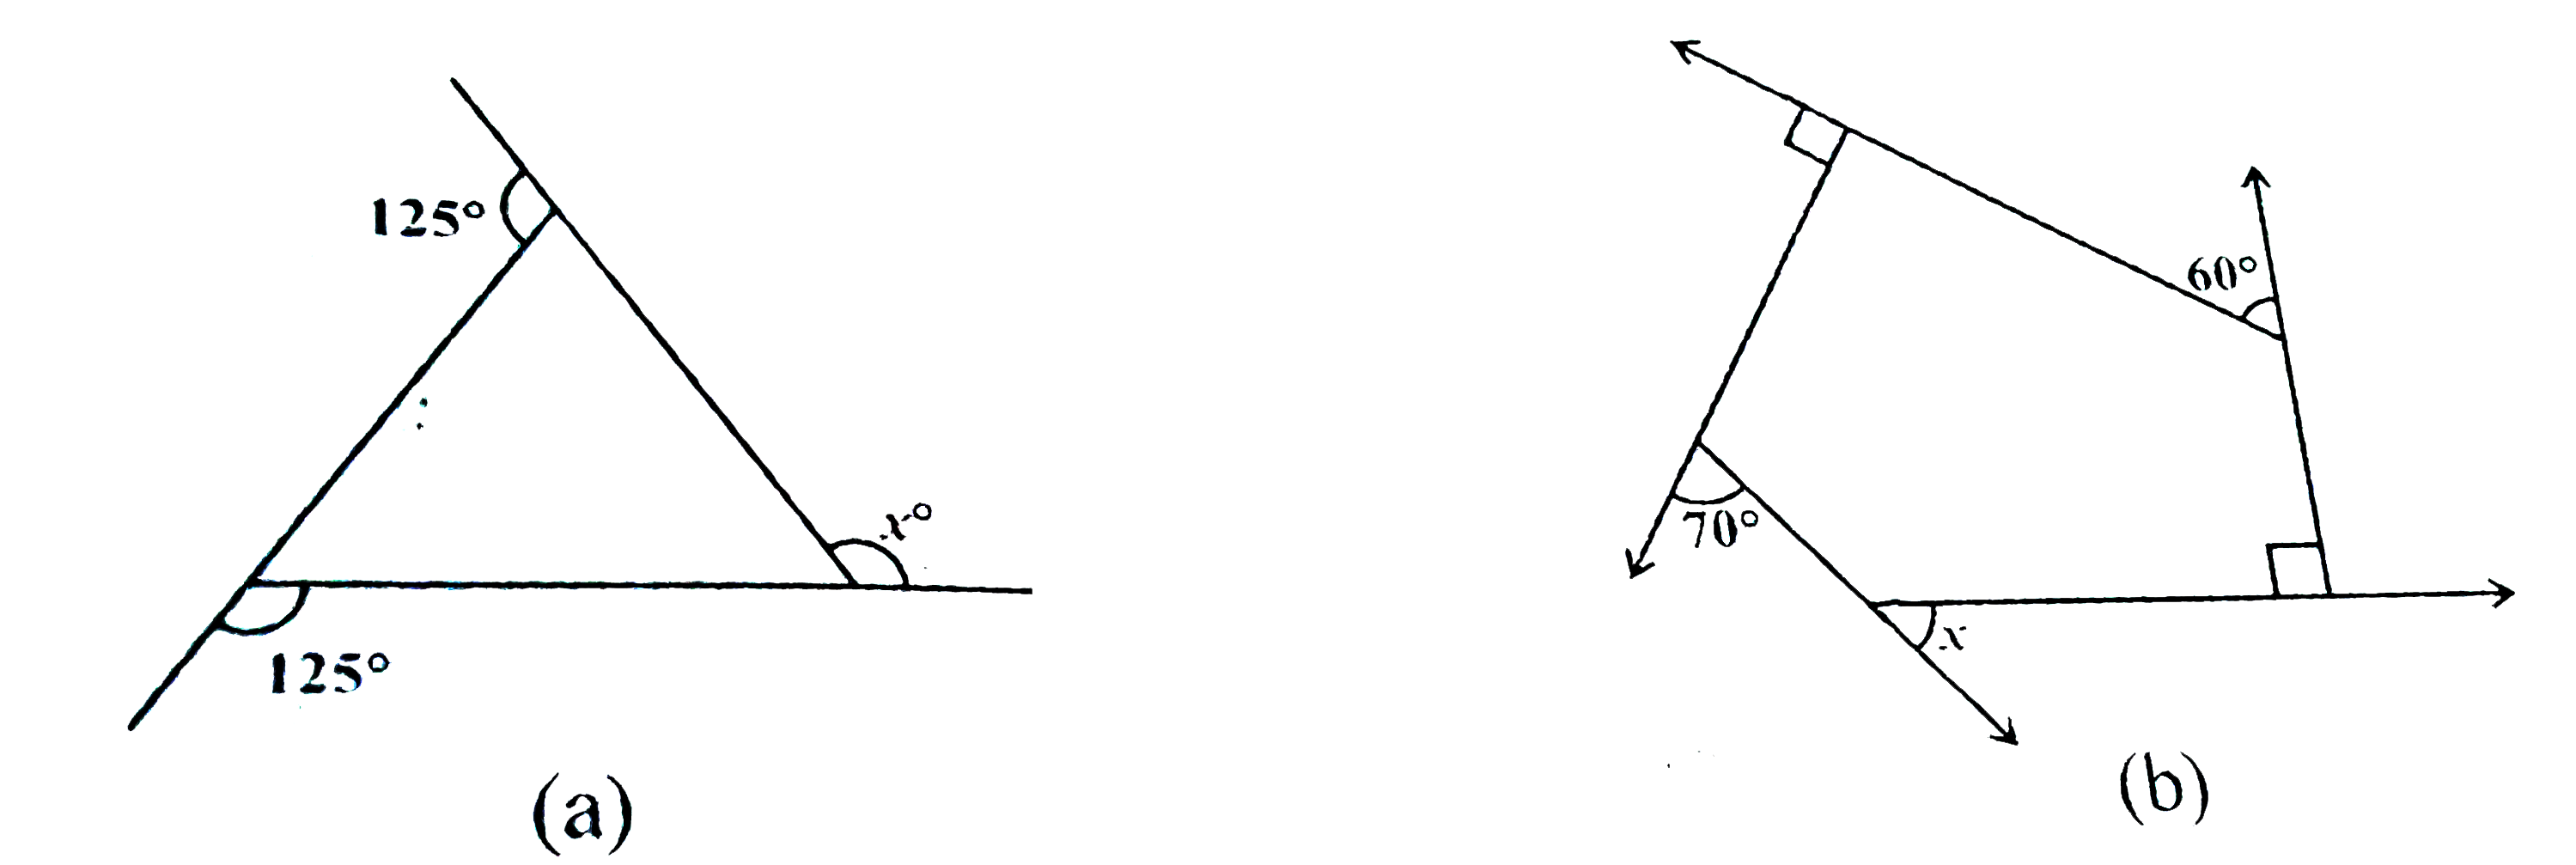
View Solutionनिम्नलिखित आकृतियों में x का मान ज्ञात कीजिए :

View Solutionगुणात्मक प्रतिलोम लिखिए
(i) 2−4 (ii) 10−5 (iii) 7−2 (iv) 5−3 (v) 10−100
View Solutionक्या किसी बहुफलक के फलक नीचे दिए अनुसार हो सकते हैं?
(i) 3 त्रिभुज (ii) 4 त्रिभुज (iii) एक वर्ग और चार त्रिभुज
View SolutionHow many lines of symmetry does the above figure have ?
View SolutionWhich of the following are correct chain isomers of butane ? (i)
View SolutionDetermine the point of symmetry of a regular hexagon.
View SolutionDtermine the images of the following figure about the given line :
View SolutionMatch the following Column A to Column B

View SolutionMatch the following Column A to Column B

View SolutionMatch the following Column A to Column B

View SolutionFind the area of the figure given below.

View SolutionThe inequation represented by the graph given below is :
View SolutionThe inequation that best describes the graph given below is _________
View SolutionThe inequation that best describes the following graph is _________
View SolutionWhich inequations represent the shaded region in the given figure
View Solution
