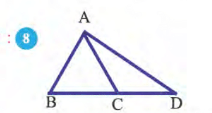
(picture) ABC সমবাহু ত্রিভুজে বর্ধিত BC বাহুর উপর বর্ধিত বাহুর উপর D যেকোনো একটি বিন্দু | প্রমাণ করো যে , ∠BAD>∠ADB
Step by step video & image solution for (picture) ABC সমবাহু ত্রিভুজে বর্ধিত BC বাহুর উপর বর্ধিত বাহুর উপর D যেকোনো একটি বিন্দু | প্রমাণ করো যে , angleBADgtangleADB by Maths experts to help you in doubts & scoring excellent marks in Class 8 exams.
Updated on:21/07/2023Topper's Solved these Questions
- বিজগানেতিক সংখ্যার সরলীকরণBOOK - NCERT BANGLISH (BANGLISH MEDIUM)CHAPTER - বিজগানেতিক সংখ্যার সরলীকরণEXERCISE - EXERCISE
40 Videos
- বিজগানেতিক সংখ্যামালার উৎপাদক বিশ্লেষণBOOK - NCERT BANGLISH (BANGLISH MEDIUM)CHAPTER - বিজগানেতিক সংখ্যামালার উৎপাদক বিশ্লেষণEXERCISE - EXERCISE
54 Videos
- বিপ্রতীপ কোণBOOK - NCERT BANGLISH (BANGLISH MEDIUM)CHAPTER - বিপ্রতীপ কোণEXERCISE - EXERCISE
15 Videos
Similar Questions
y= 2 হলে নীচের বীজগাণিতিক সংখ্যামালাটির মান বের করো : y2+y−3
View Solution(x−1)(x+3)(x−2)(x−6)+96 -কে উৎপাদকে বিশ্লেষণ করার চেষ্টা করো |
View Solutionদুটি সরলরেখা AB এবং CD পরস্পরকে O বিন্দুতে ছেদ করেছে |OX এবং OY যথাক্রমে ∠AOD ও ∠BOC-এর সমদ্বিখণ্ডক | প্রমাণ করো OX এবং OY একই সরলরেখায় অবস্থিত|
View SolutionIdentify the cell organelle 'A' :-
ltimg src="https://d10lpgp6xz60nq.cloudfront.net/physics_images/ALN_BIO_C10_E08_018_Q01.png" width="80%"gt
View SolutionHow many lines of symmetry does the above figure have ?
View SolutionWhich of the following are correct chain isomers of butane ? (i)
View SolutionDetermine the point of symmetry of a regular hexagon.
View SolutionDtermine the images of the following figure about the given line :
View SolutionMatch the following Column A to Column B

View SolutionMatch the following Column A to Column B

View SolutionMatch the following Column A to Column B

View SolutionFind the area of the figure given below.

View SolutionThe area of the shaded part in the figure given below is ______.

View SolutionThe inequation represented by the graph given below is :
View SolutionThe inequation that best describes the graph given below is _________
View SolutionThe inequation that best describes the following graph is _________
View Solution
