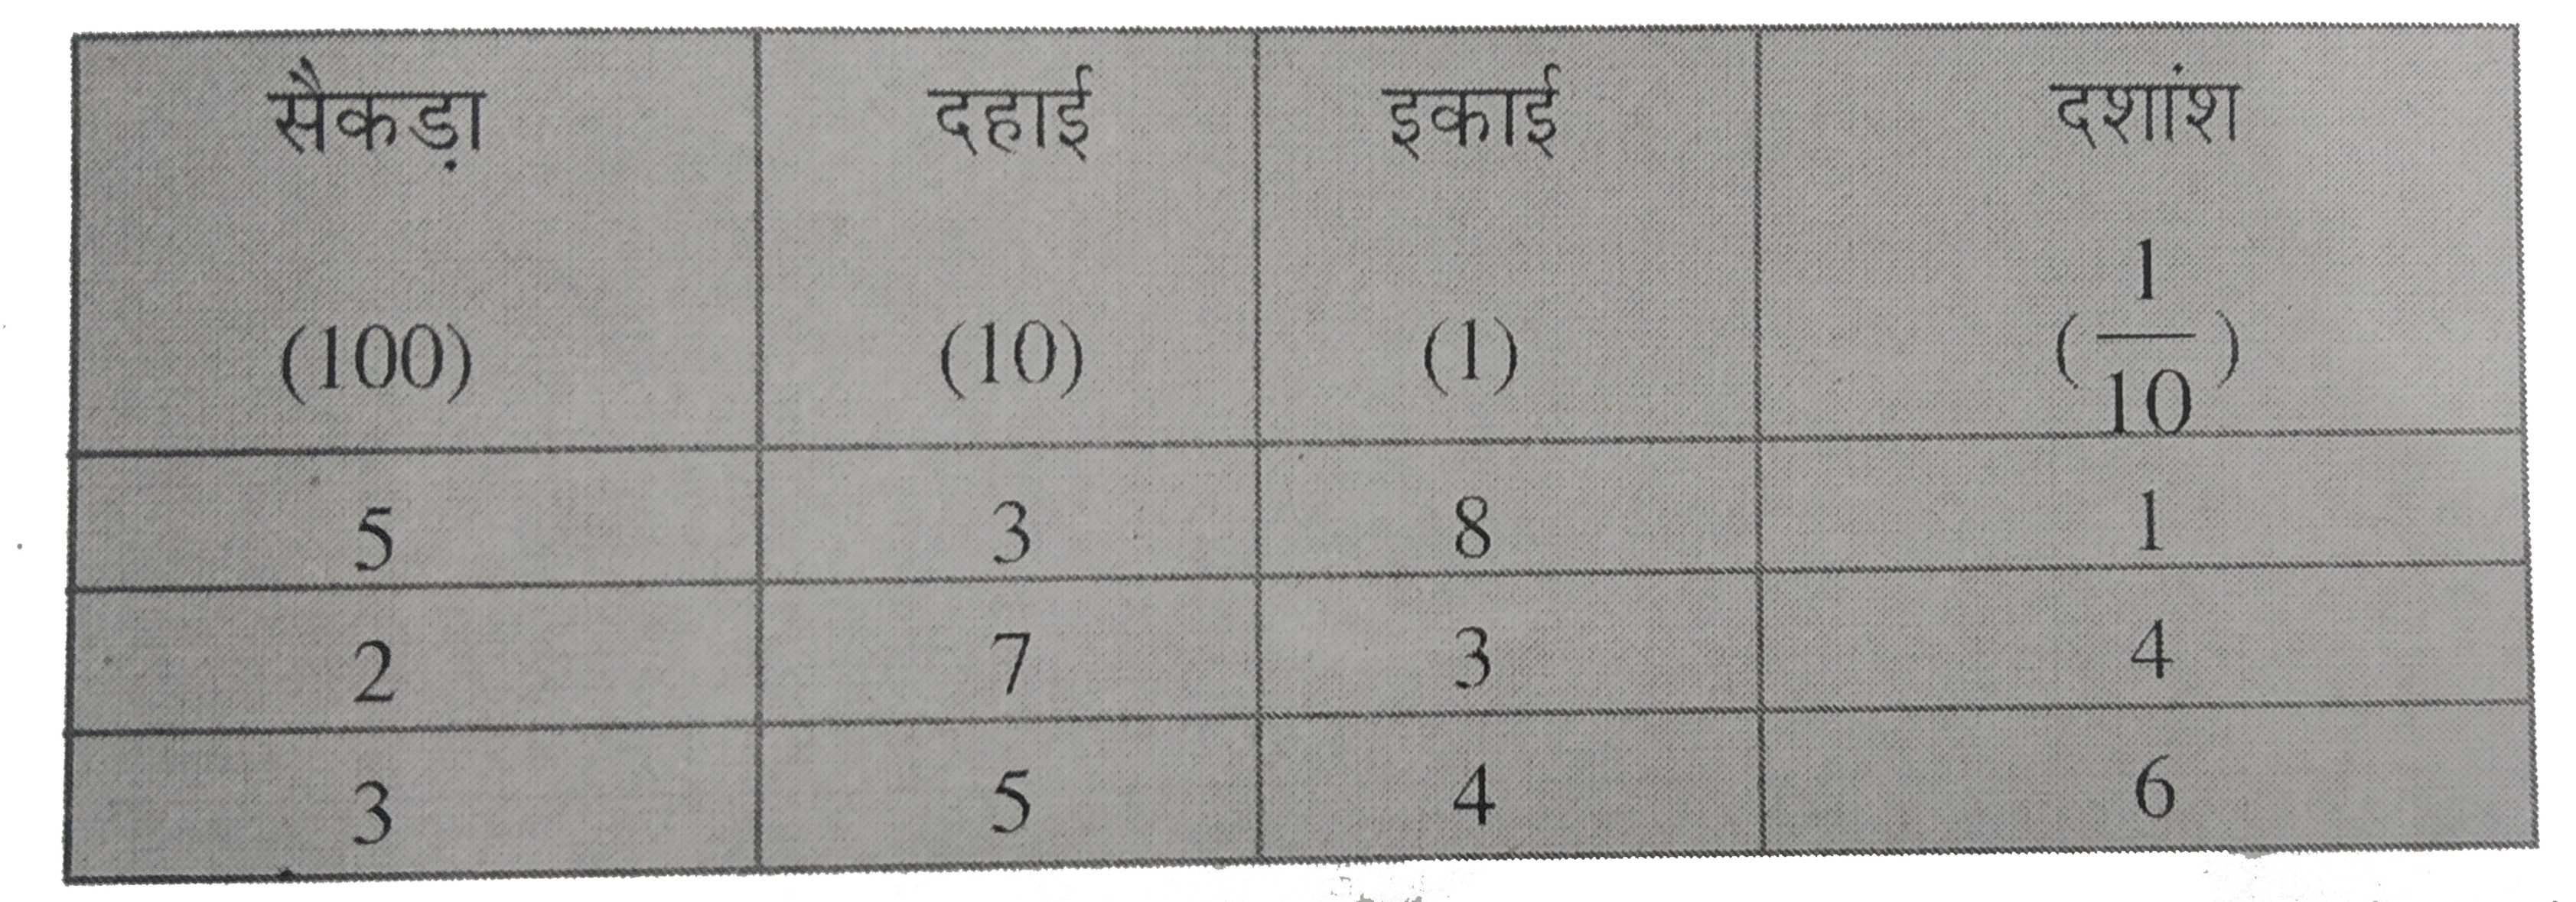
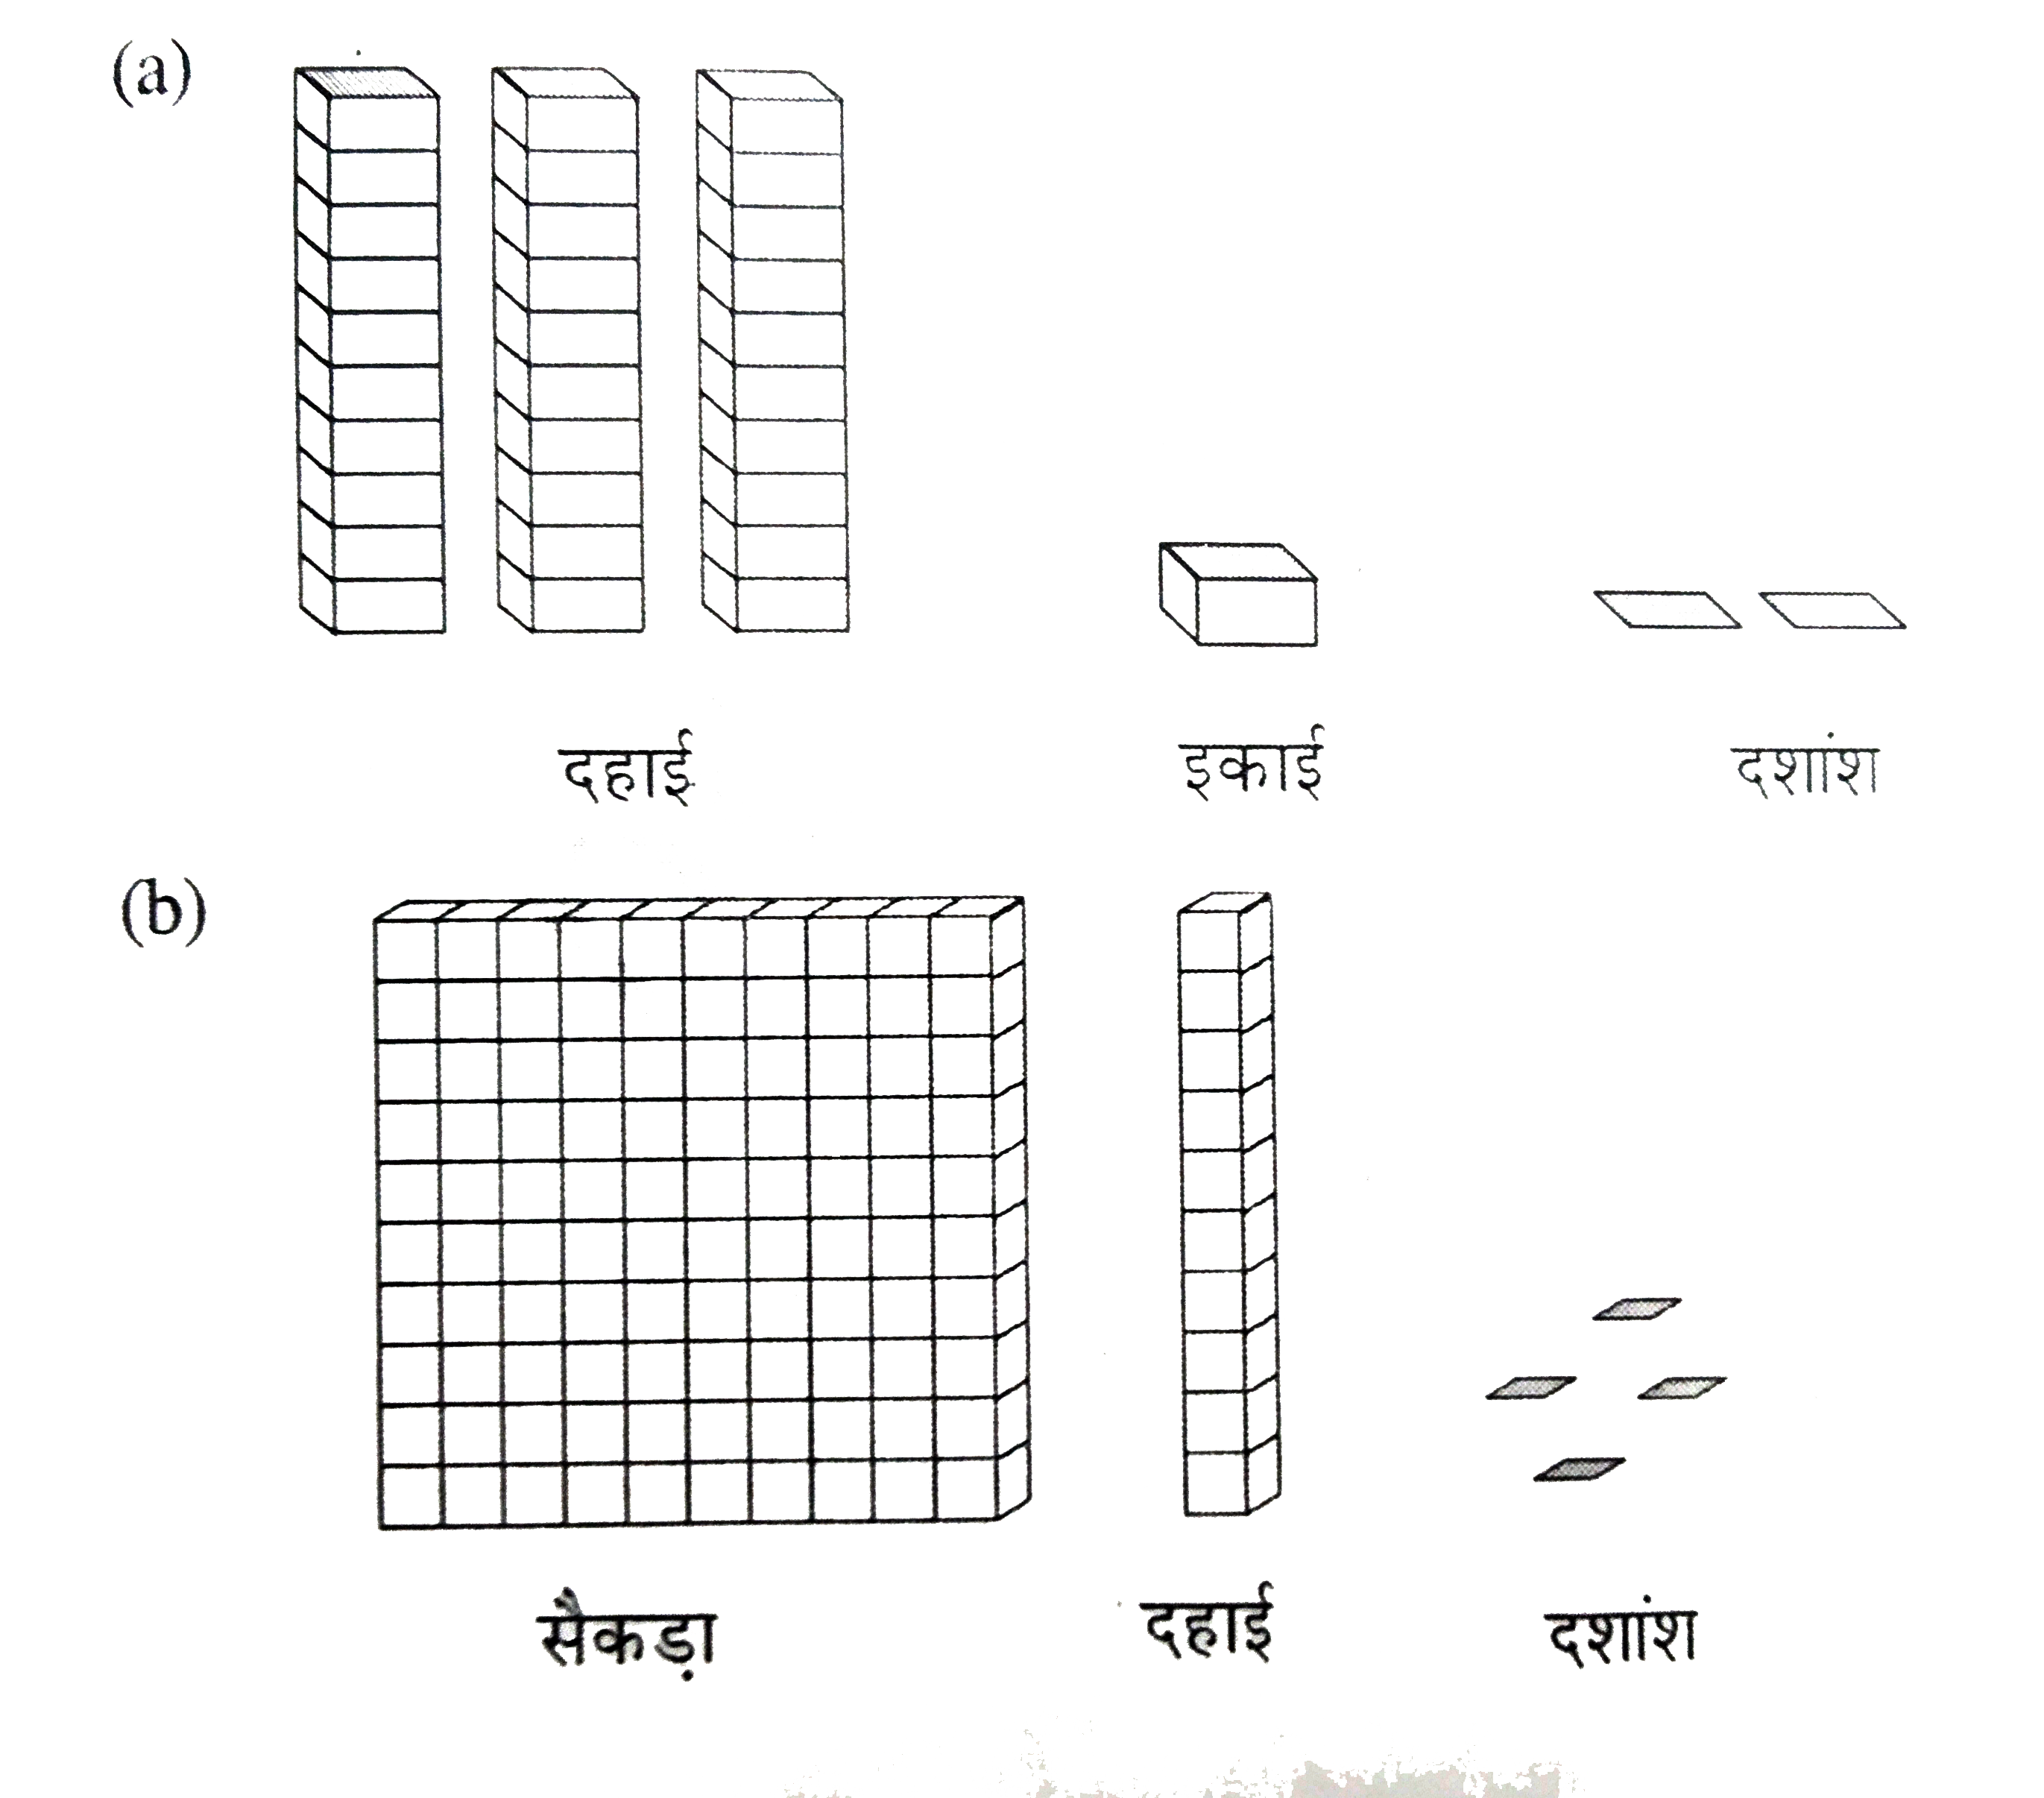
दी गई स्थानीय मान सारणी से संख्या को दशमलव रूप में लिखिए:

Step by step video & image solution for दी गई स्थानीय मान सारणी से संख्या को दशमलव रूप में लिखिए: by Maths experts to help you in doubts & scoring excellent marks in Class 6 exams.
Updated on:21/07/2023Topper's Solved these Questions
- दशमलव BOOK - NCERT HINDICHAPTER - दशमलव EXERCISE - प्रयास कीजिए
12 Videos
- दशमलव BOOK - NCERT HINDICHAPTER - दशमलव EXERCISE - प्रश्नावली 8.1
10 Videos
- क्षेत्रमिति BOOK - NCERT HINDICHAPTER - क्षेत्रमिति EXERCISE - प्रश्नावली 10.3
18 Videos
- दिमागी - कसरत BOOK - NCERT HINDICHAPTER - दिमागी - कसरत EXERCISE - अभ्यास
28 Videos
Similar Questions
क्या आप निम्न को दशमलव रूप में लिख सकते है

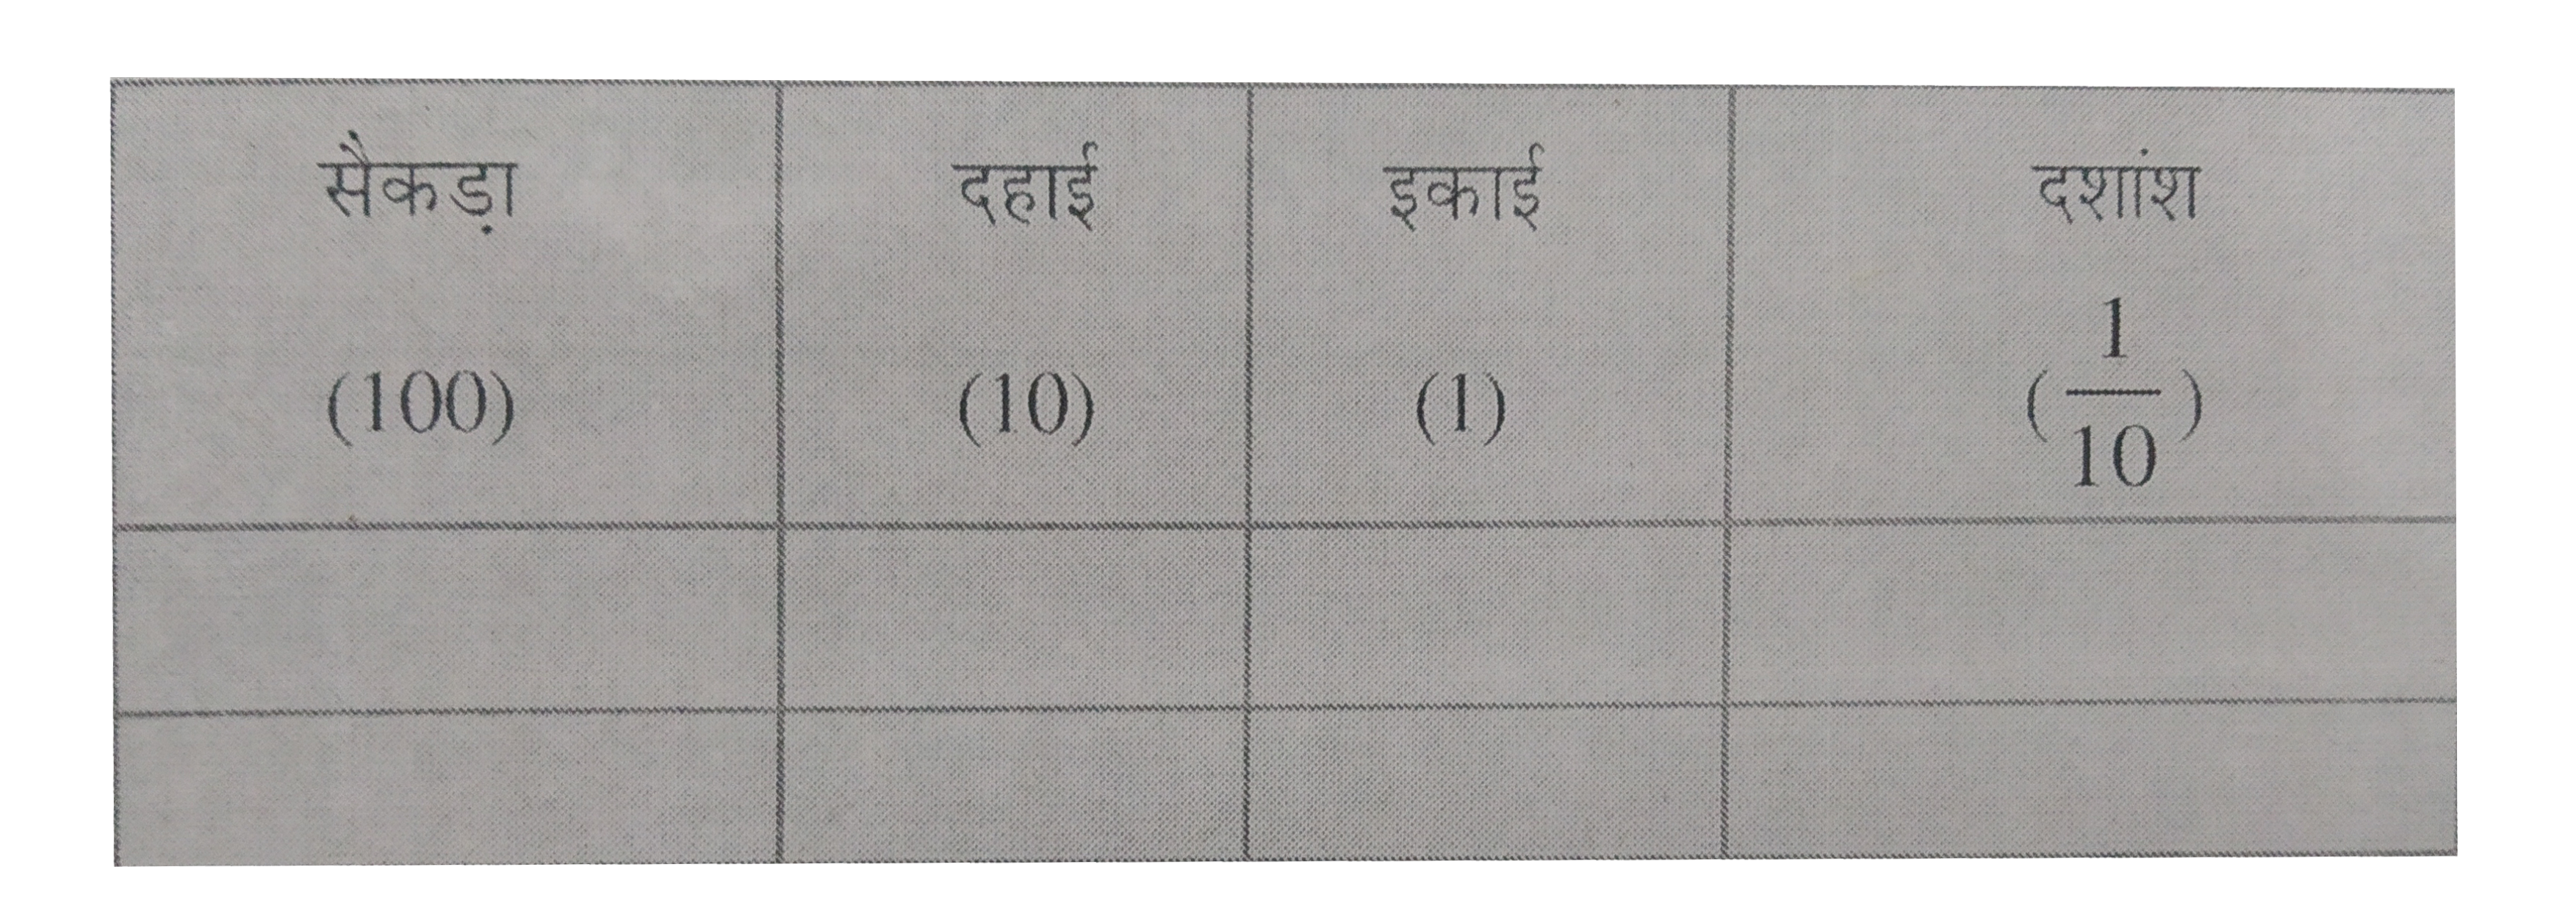
View Solutionनिम्न के लिए दी गई सारणी में संख्याए लिखिए :


View Solutionउन आयतों का क्षेत्रफल ज्ञात कीजिय जिनकी भुजाएँ निचे दी गई है :
3 सेमी और 4 सेमी
View Solutionआमों की एक टोकरी से आमों के दो-दो के समूह में गिनने पर एक बचत है ,तीन तीन के समूहों में गिनने पर दो बचते हैं, चार चार के समूह में गिनने पर तीन बचते हैं पाँच-पाँच के समूह में गिनने पर चार बचते हैं छह-छह के समूह में गिनने पर पांच बचते हैं लेकिन सात के समूह बनाकर गिनने पर कुछ शेष नहीं बचता | टोकरी में काम से काम किंतने आम थे ?

View SolutionHow many lines of symmetry does the above figure have ?
View SolutionWhich of the following are correct chain isomers of butane ? (i)
View SolutionDetermine the point of symmetry of a regular hexagon.
View SolutionDtermine the images of the following figure about the given line :
View SolutionMatch the following Column A to Column B

View SolutionMatch the following Column A to Column B

View SolutionMatch the following Column A to Column B

View SolutionFind the area of the figure given below.

View SolutionThe area of the shaded part in the figure given below is ______.

View SolutionThe inequation represented by the graph given below is :
View SolutionThe inequation that best describes the graph given below is _________
View SolutionThe inequation that best describes the following graph is _________
View Solution
